Case Studies
I build pipelines that scale and dashboards people actually use. Here are five times I turned messy data into clear answers.
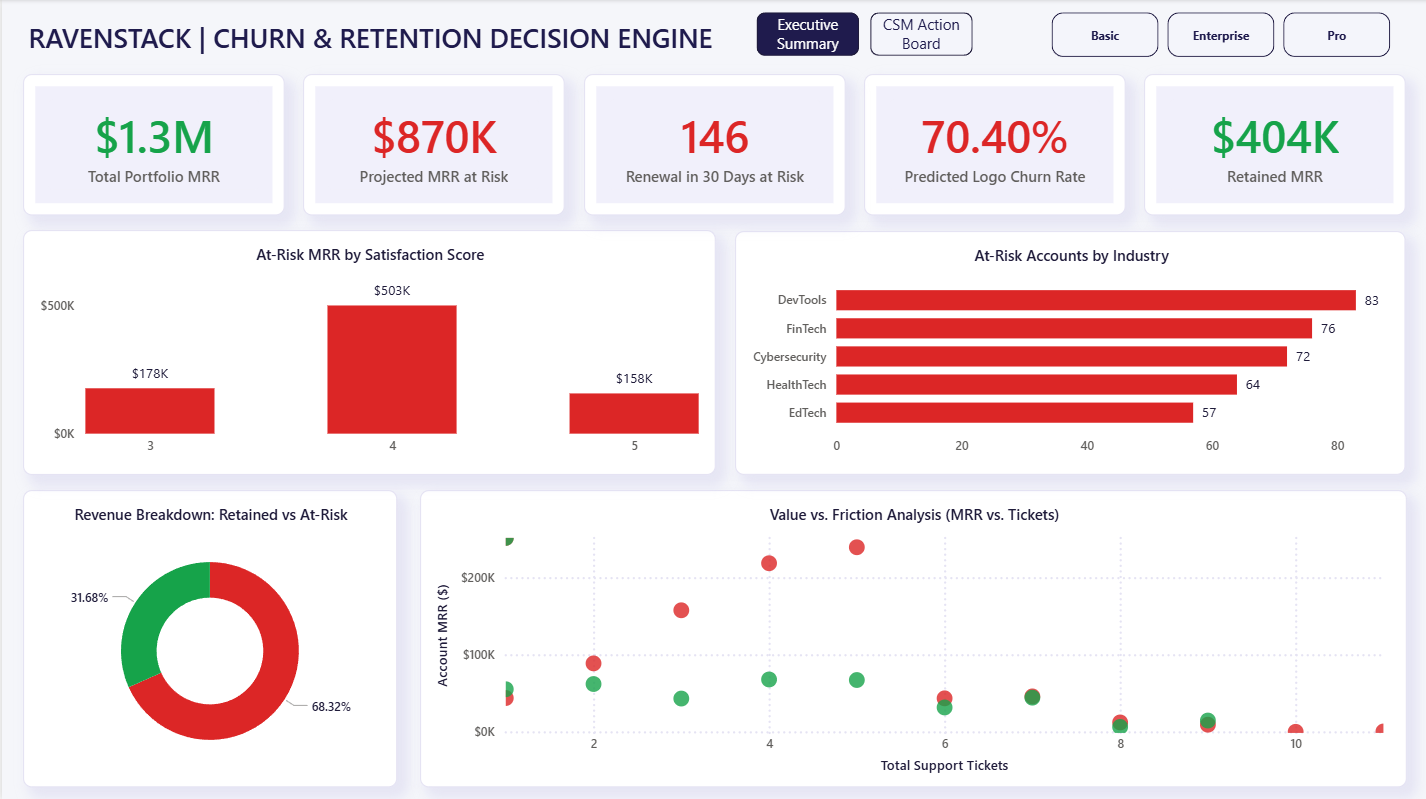
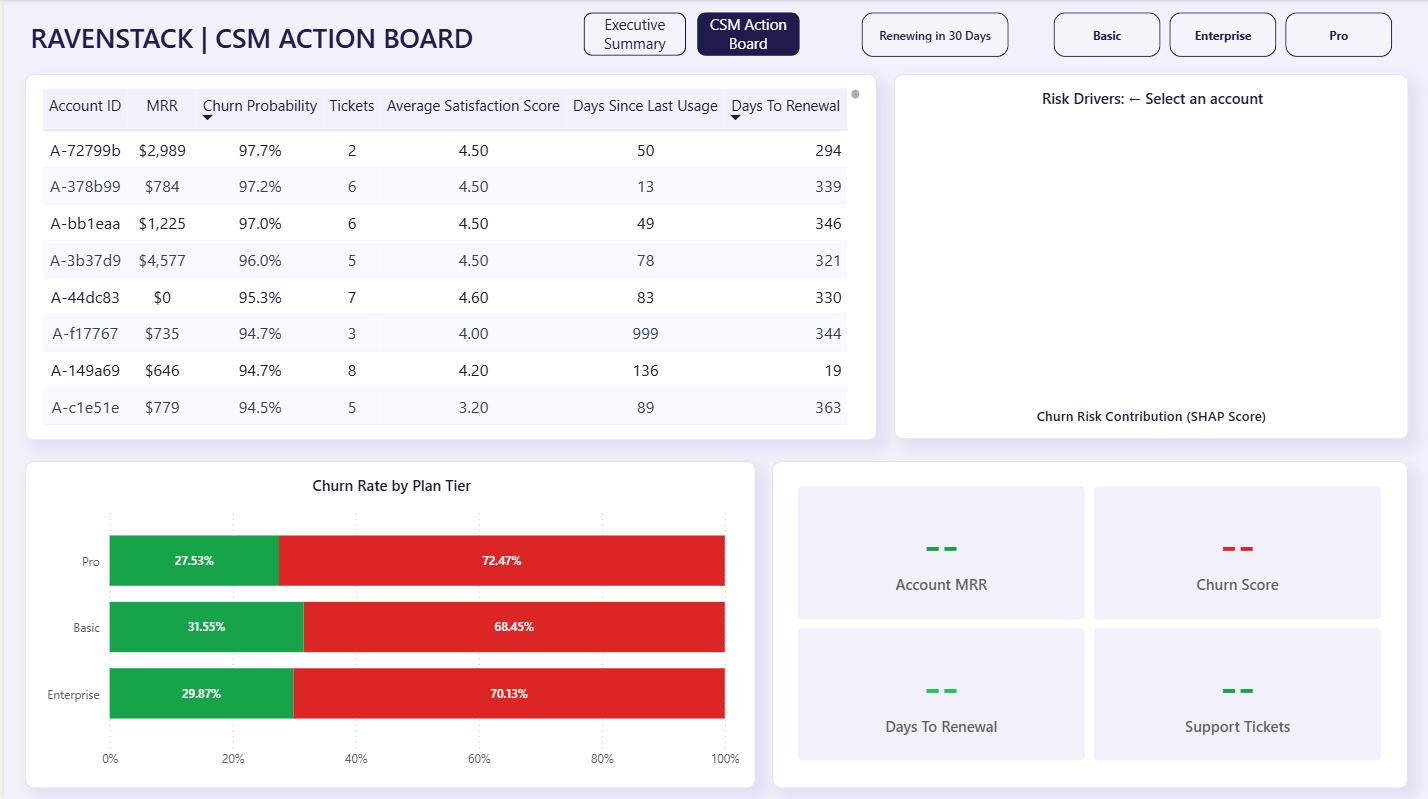
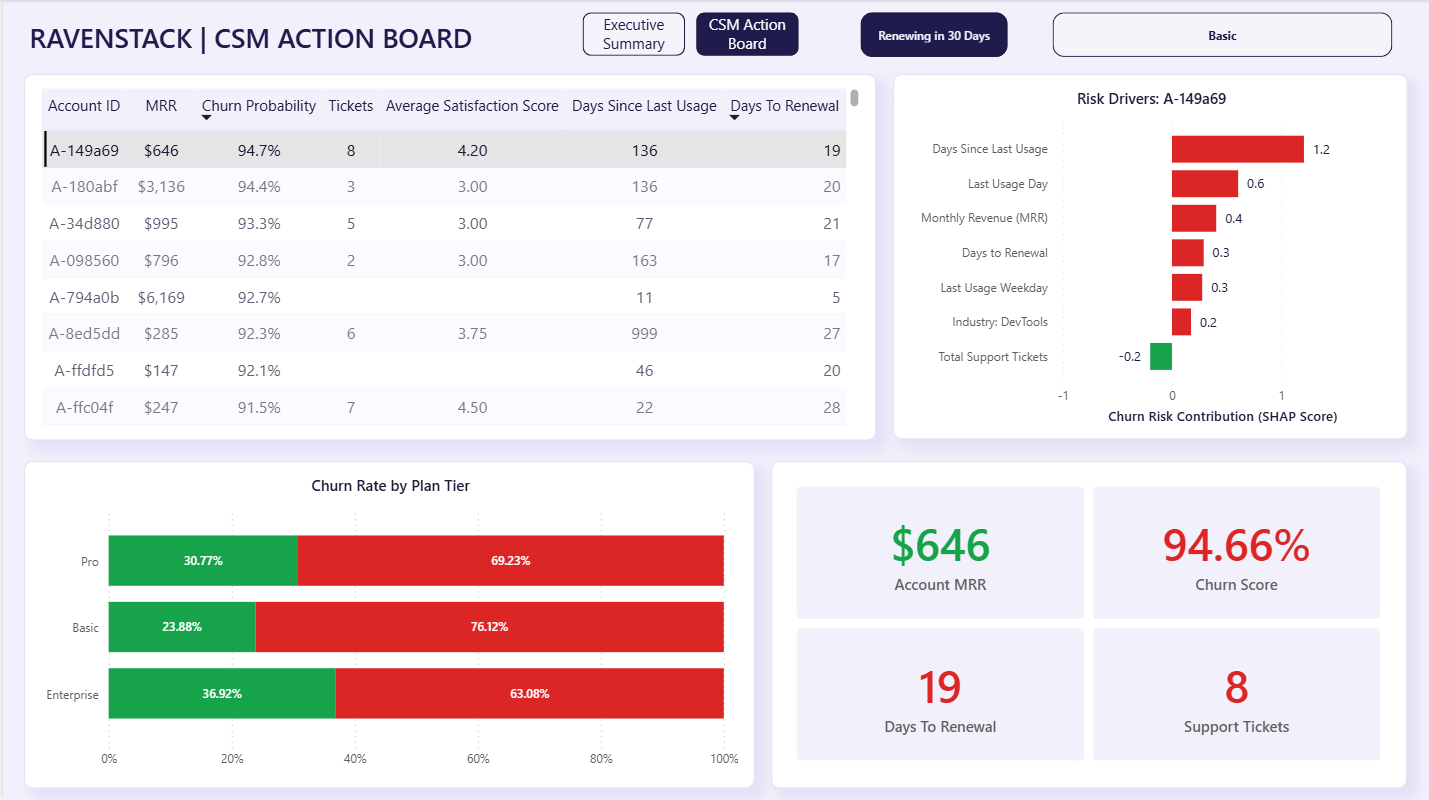
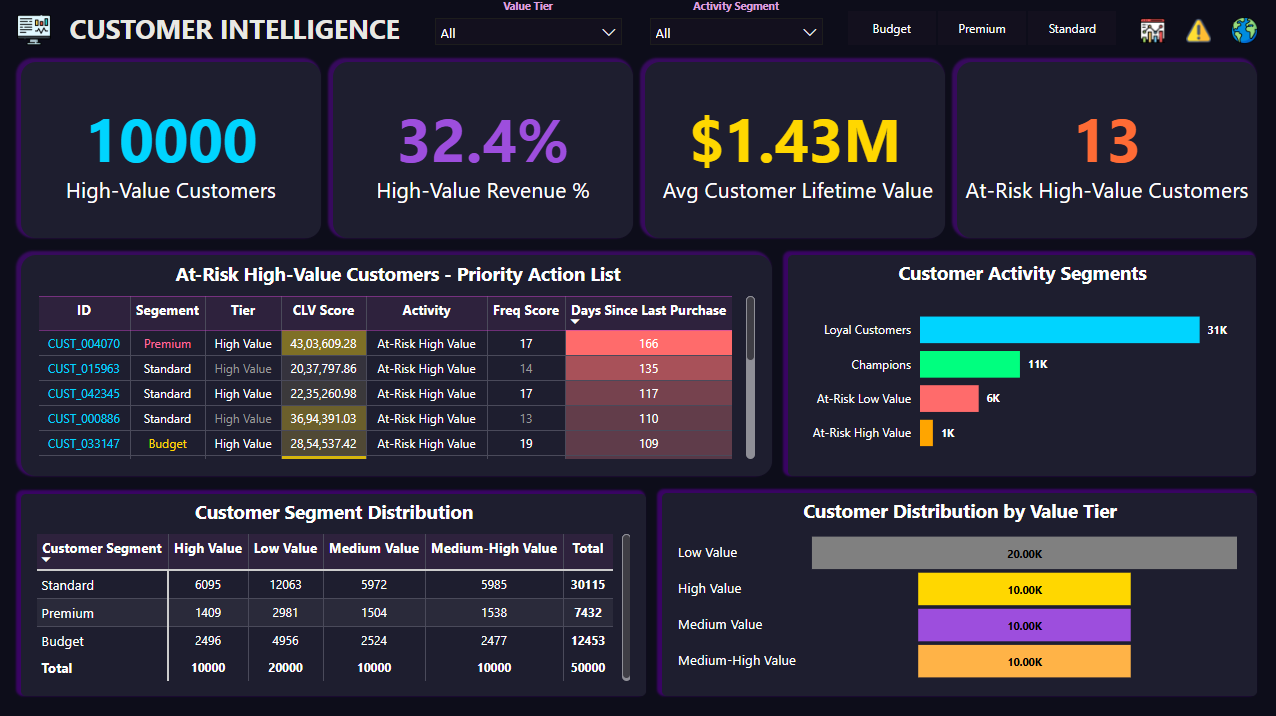
Customer Churn Decision Engine
Identified $870K in at-risk MRR by building a predictive XGBoost pipeline on top of Google BigQuery. I integrated SHAP values directly into a live Power BI dashboard so Customer Success managers know exactly what behavioral drivers are pushing an account to cancel.
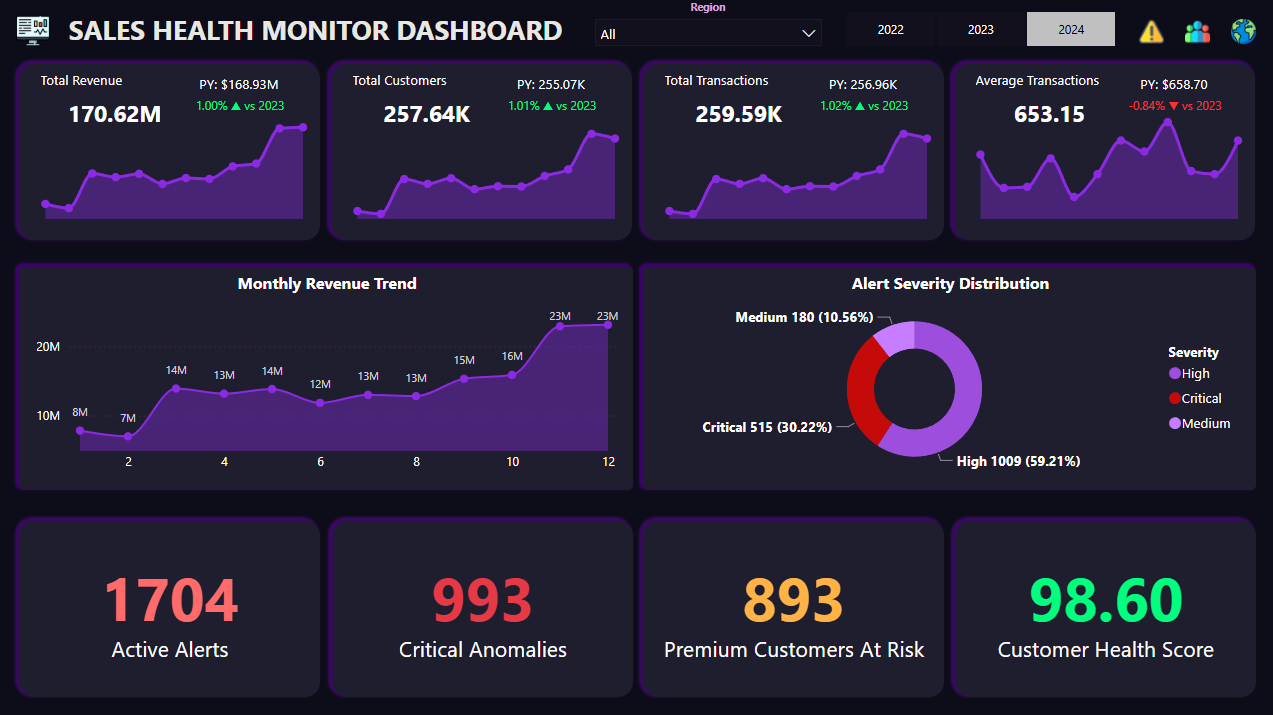
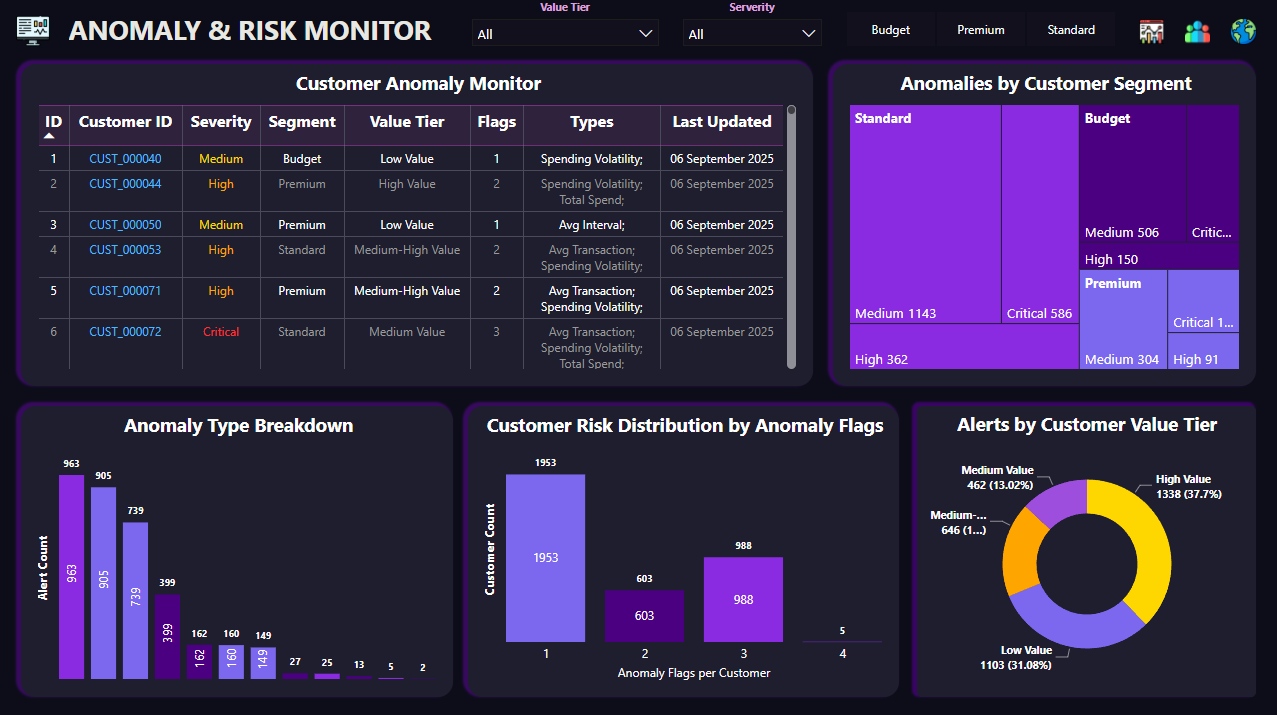
Retail Revenue & Anomaly Detection
Processed over 800,000 records through a custom star schema. I built an anomaly detection layer that cut false alerts by 85%, feeding a Power BI dashboard that tracks revenue exactly.
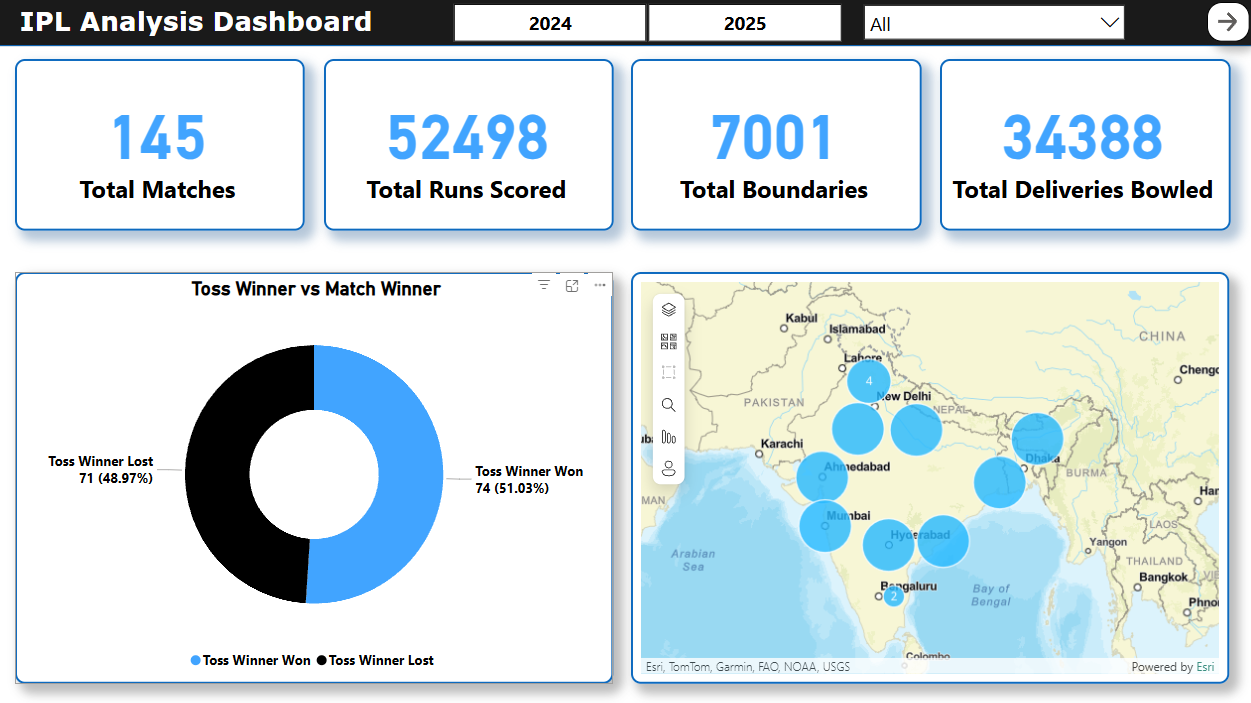
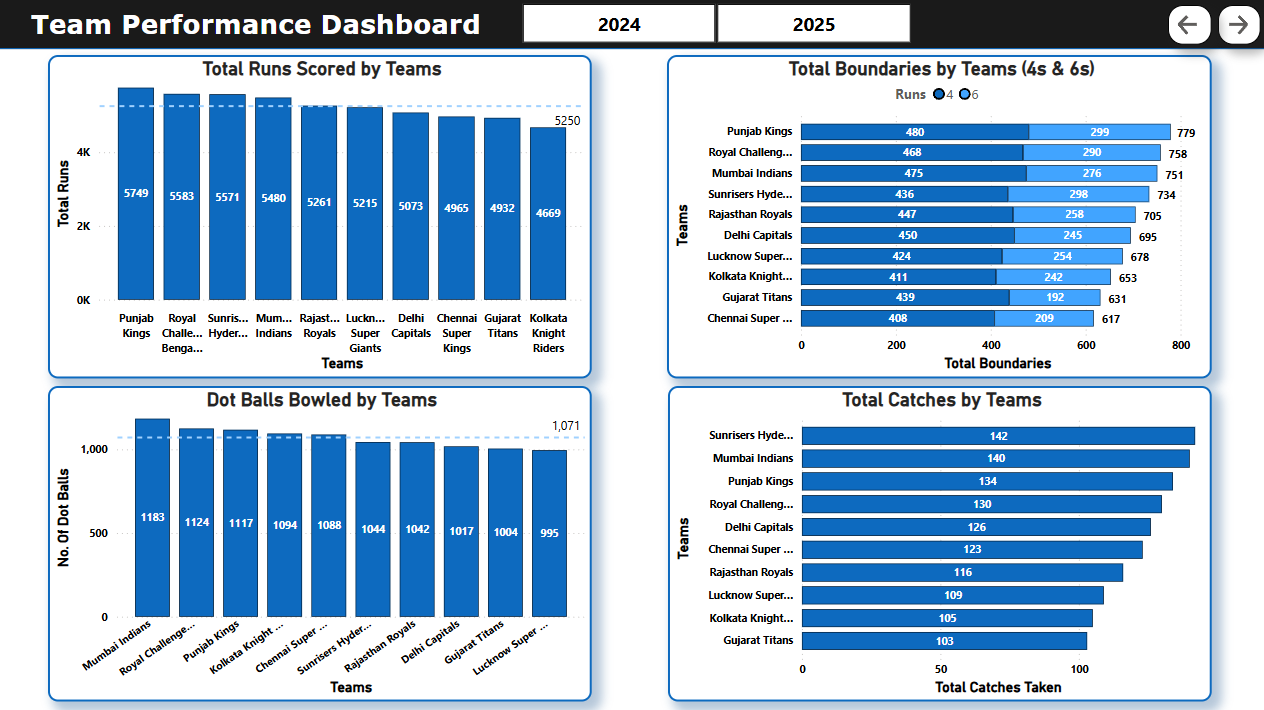
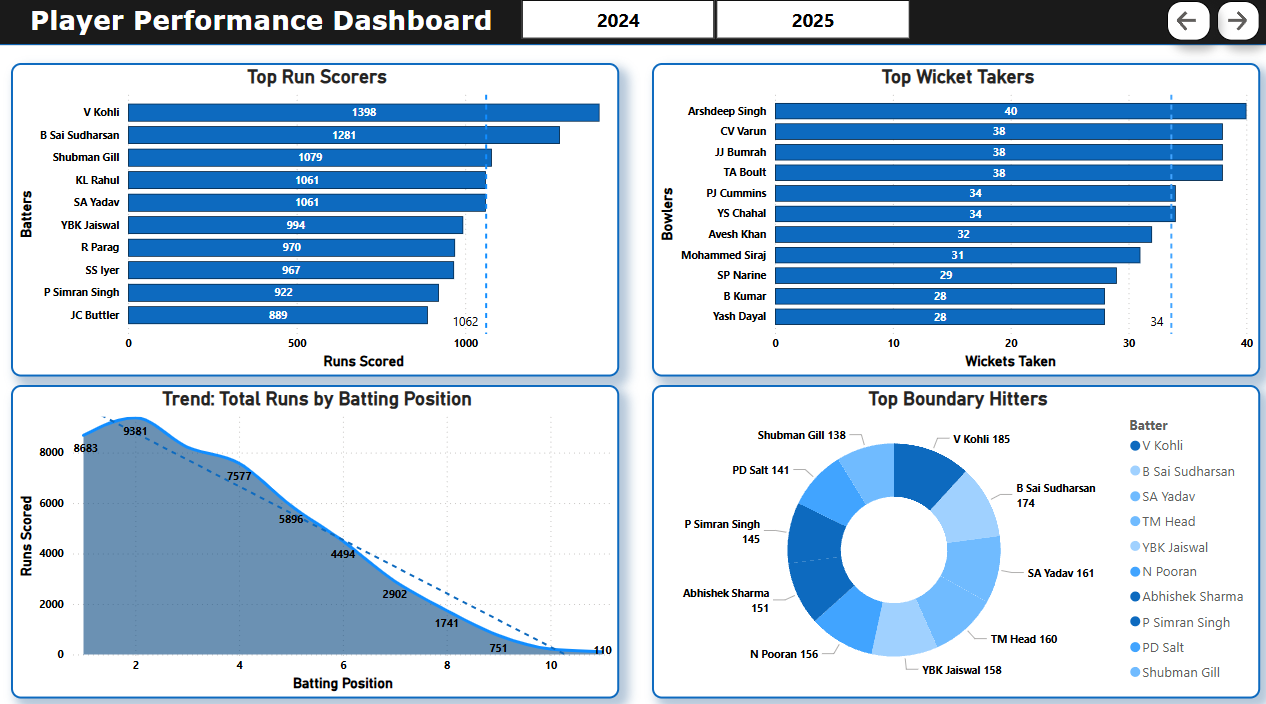
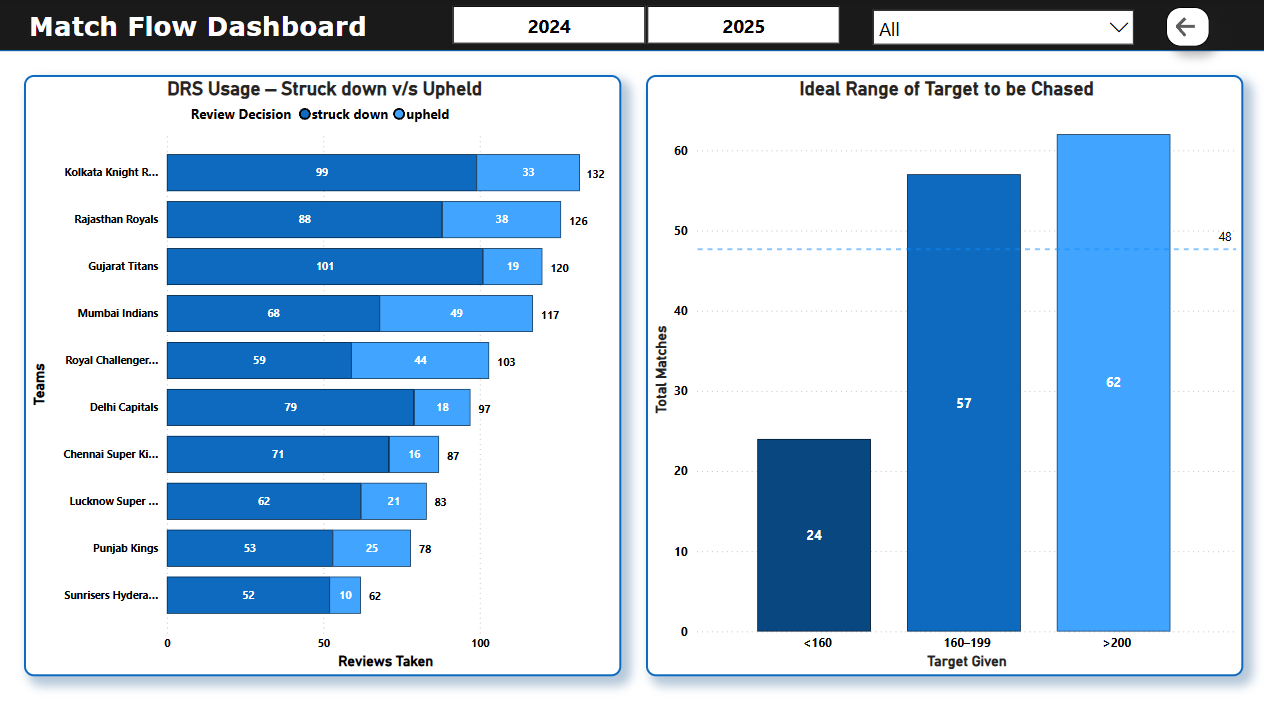
Performance Forecasting Model
Analyzed 145 datasets to see what actually drives team performance. The dashboard tracks batting trends and boundary patterns so coaches can build strategies based on data, not just gut feeling.
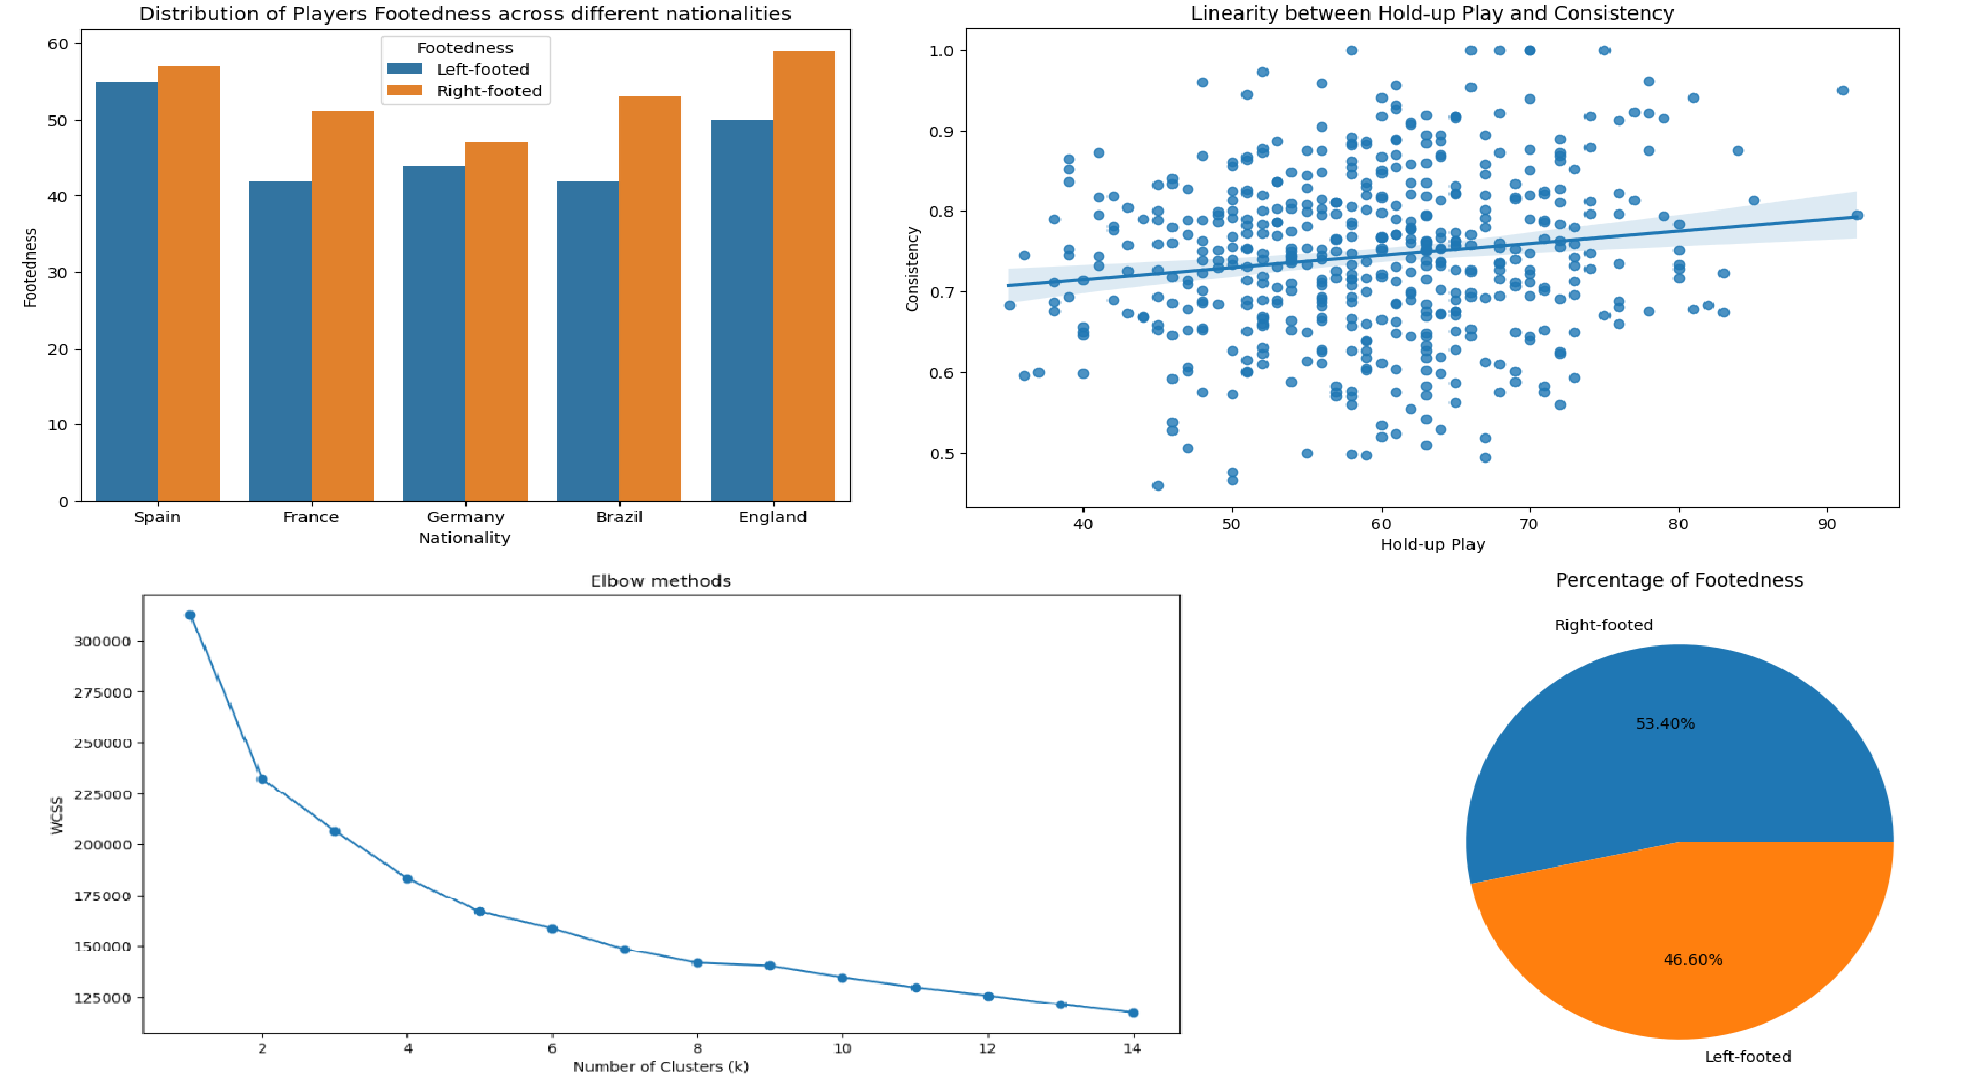
Football Striker Segmentation
Used K-Means clustering on 500 elite players to find out what really leads to goals. I built custom contribution scores and a classification model to predict how a player will perform on the pitch.
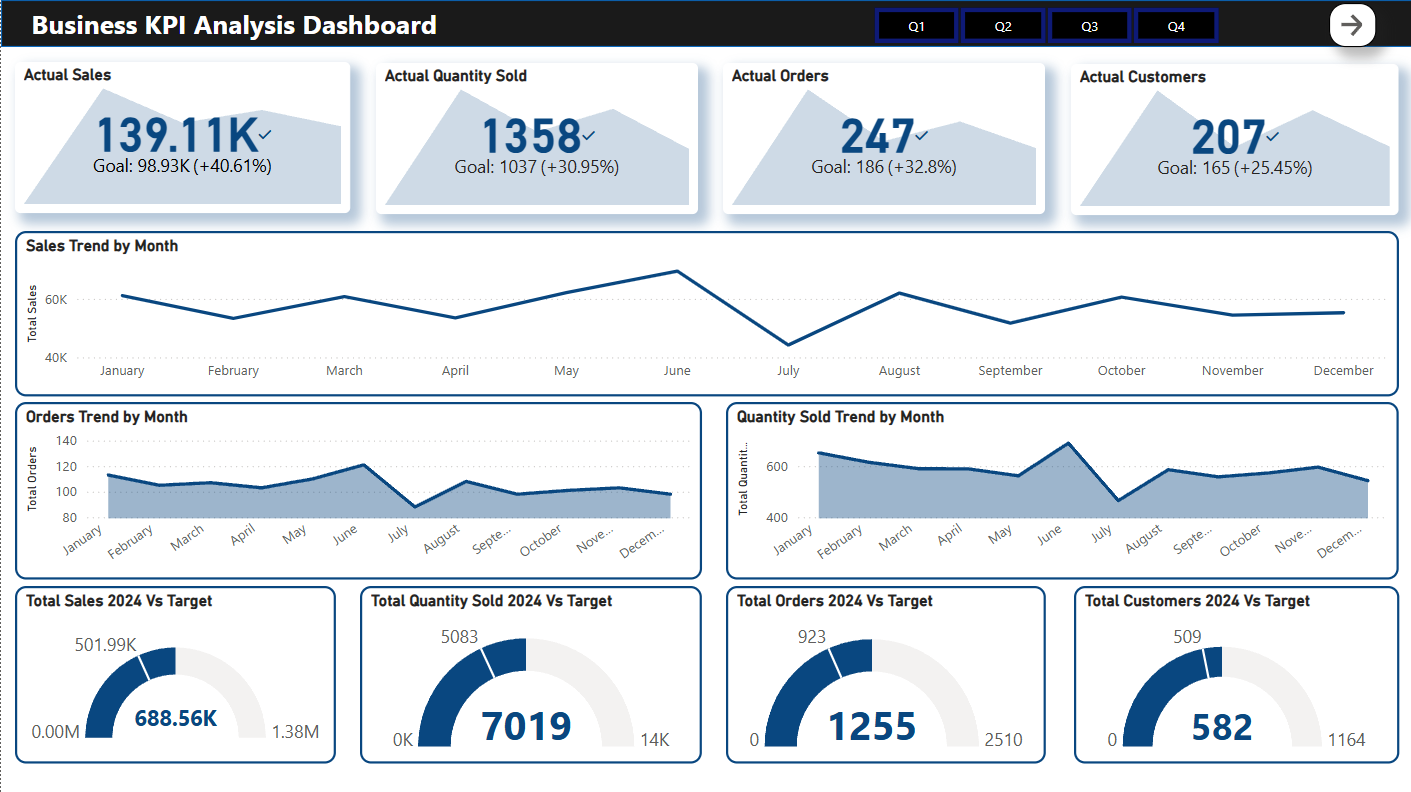
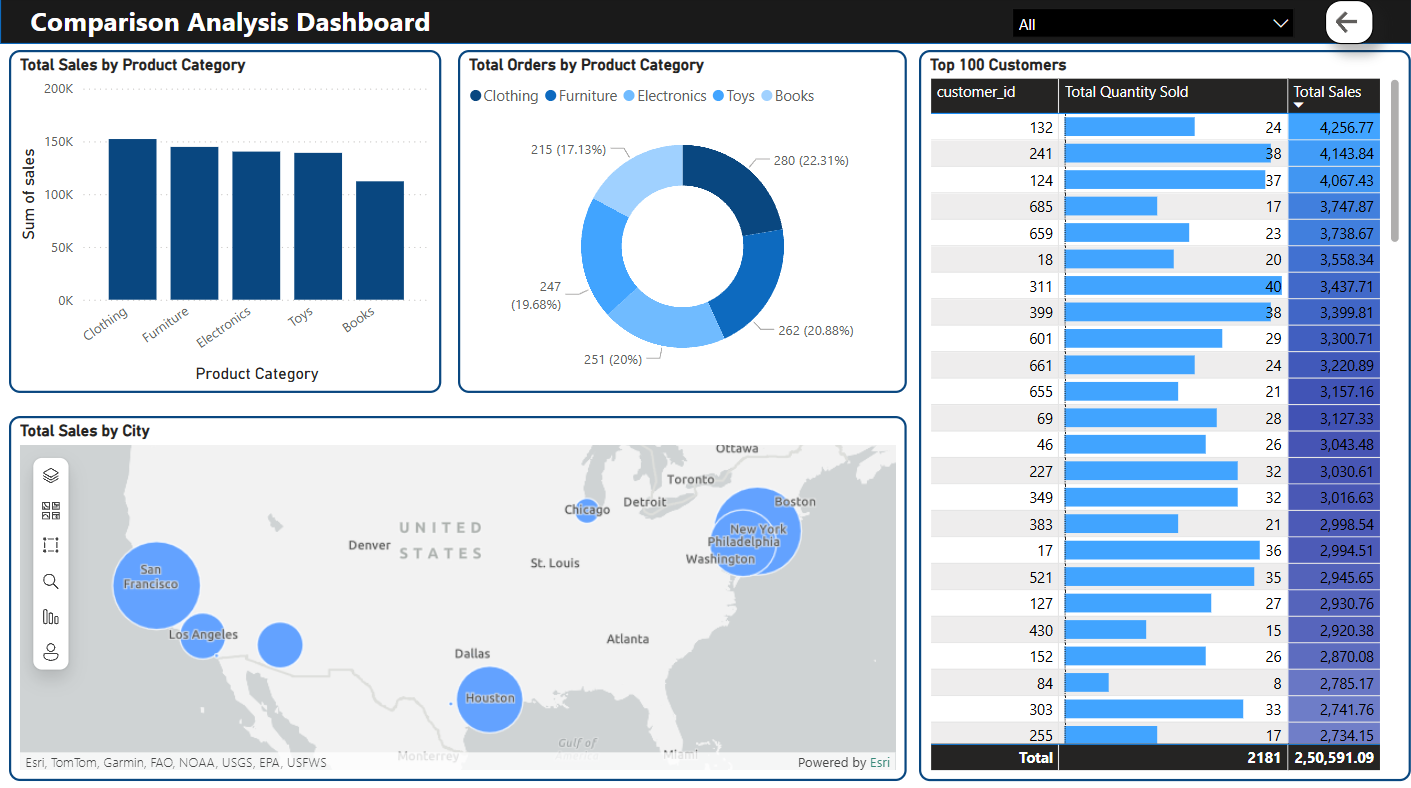
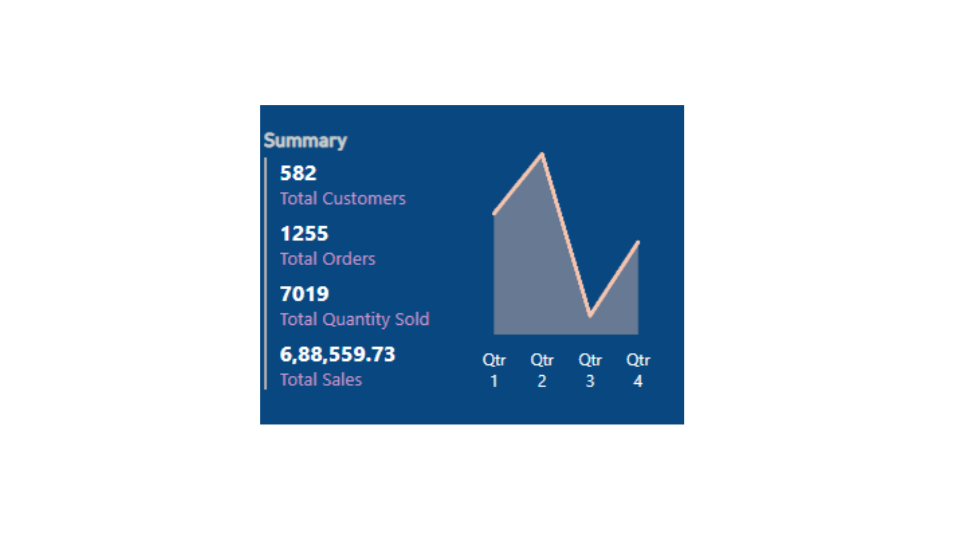
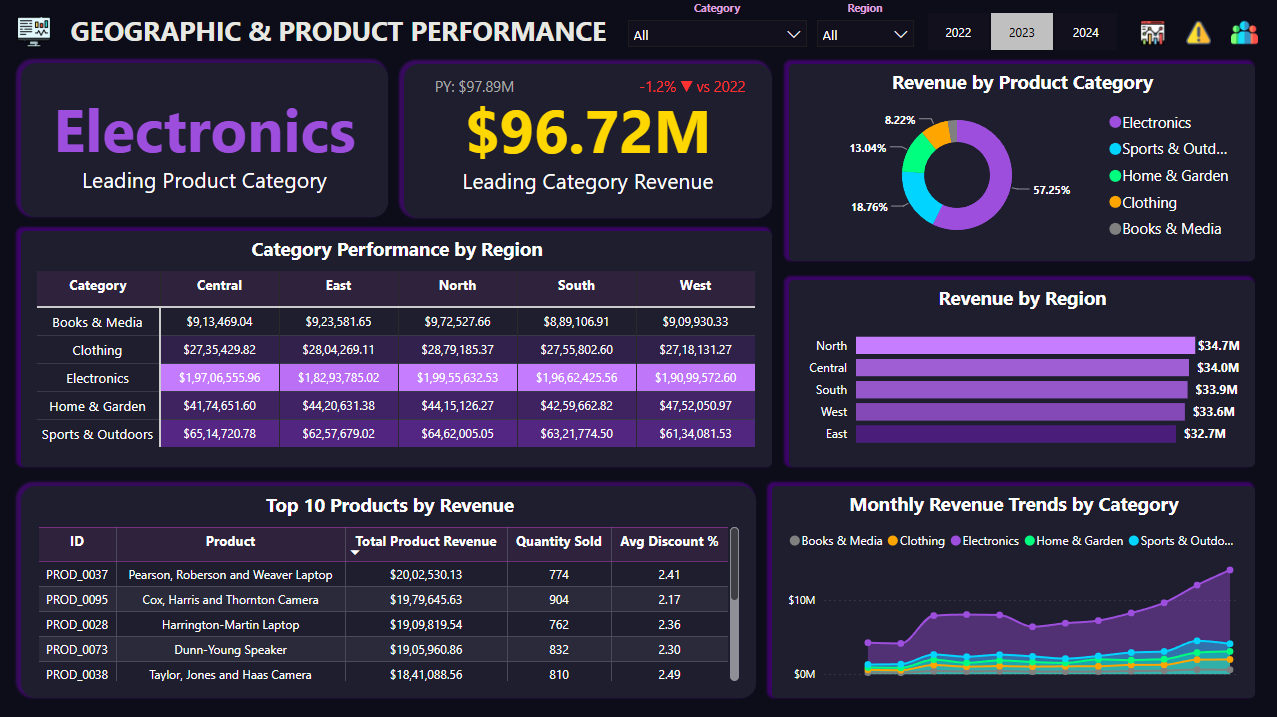
Year-Over-Year Sales Analytics
A dashboard comparing 2023 against 2024. I generated synthetic data with Python to map out year-over-year growth, customer habits, and city-level trends in Power BI.
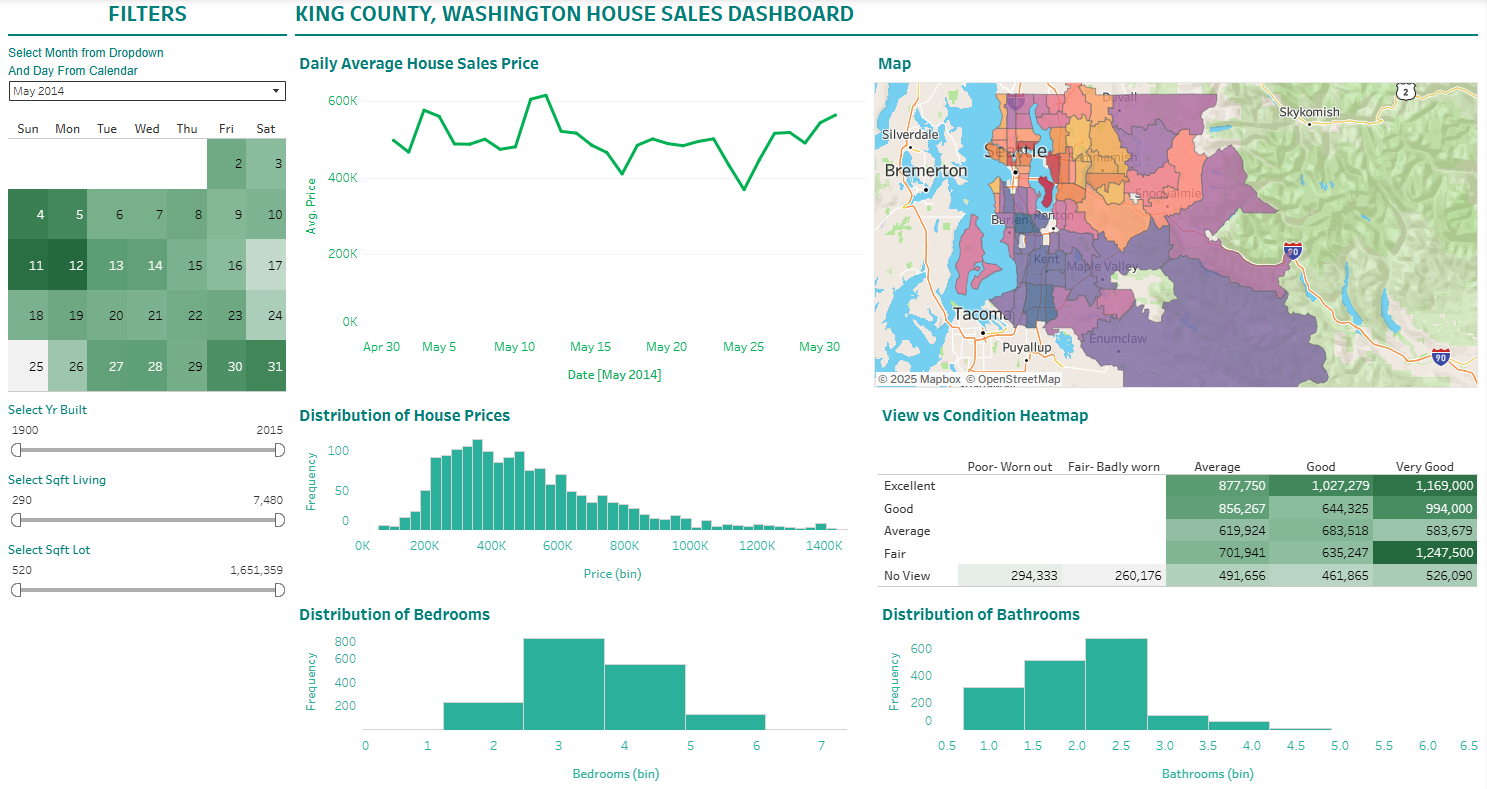
Geospatial Real Estate Valuation
Turned messy King County housing records into an interactive map. It filters valuations by condition and build year to show exactly how much location changes the price.