Retail Revenue & Anomaly Detection
Retail Revenue &
Anomaly Detection
An analytics pipeline that turns raw transaction logs into plain answers. I built an anomaly detection model that cut false alerts by 85% and gave leadership a dashboard they can actually use themselves.
Retail generates noise faster than humans can filter it. The business was processing millions of transactions but couldn't separate a real performance drop from a normal seasonal dip. They needed an automated layer that didn't just draw charts, but told them exactly where to look.
The Methodology
1. Data Generation & Architecture
Simulated a retail dataset with 50,000 customers and 500 products. I cleaned the intentionally messy data in Python, then built a MySQL Star Schema with 11 views so the BI tools wouldn't bottleneck.
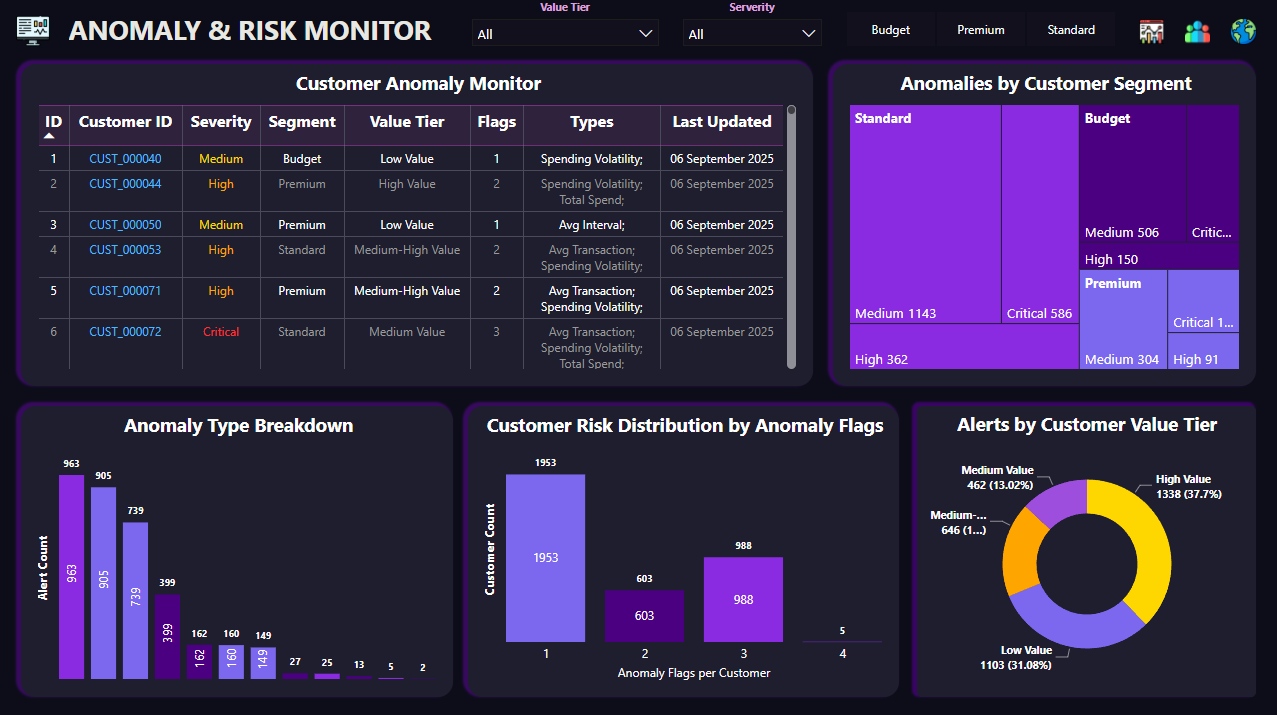
2. Adaptive Anomaly Detection
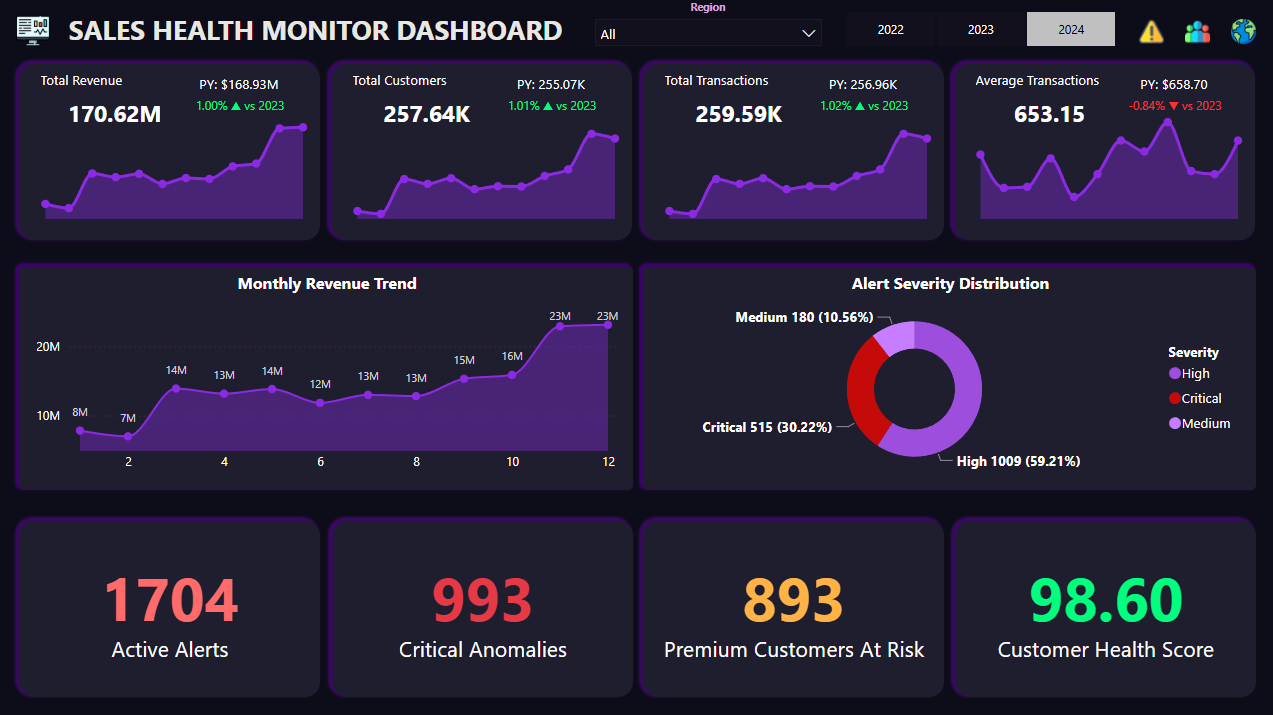
I replaced their rigid alerts with a dynamic, percentile-based model built entirely in SQL. It adapted automatically to the holiday volume spikes, bringing false alarms down from over 10,000 to just 1,524.
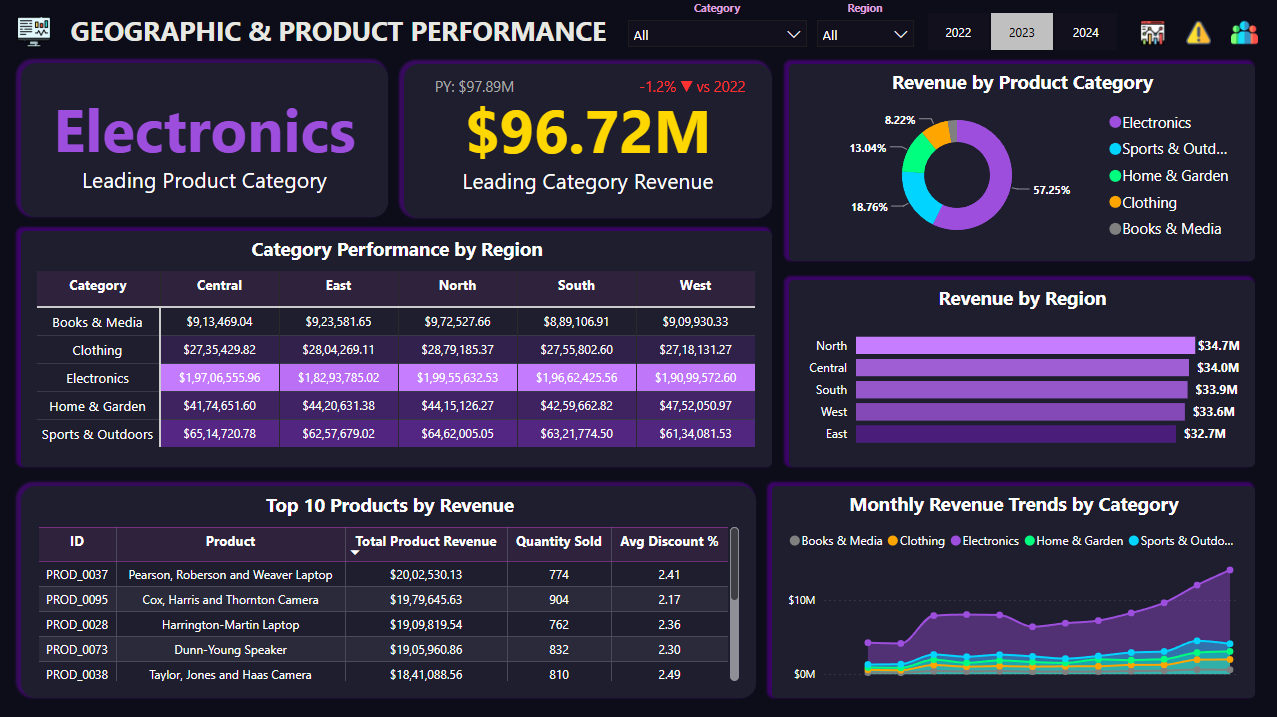
3. Executive BI
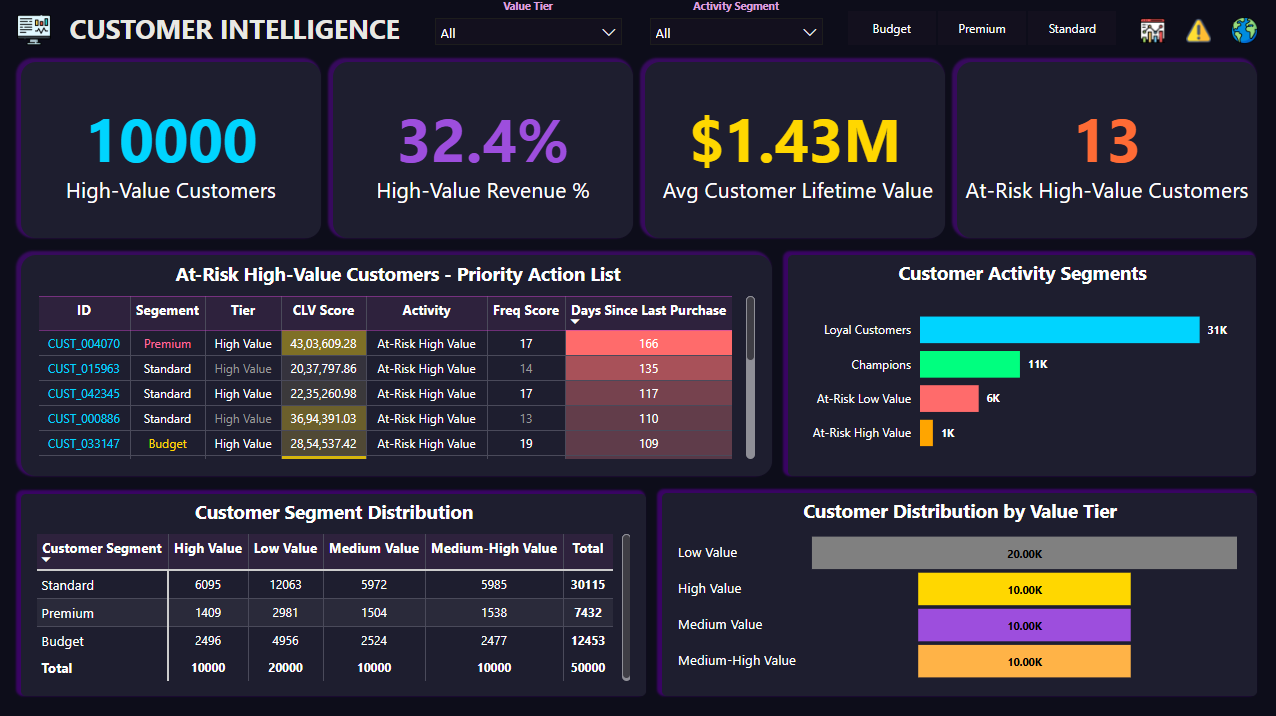
Built four Power BI pages using custom DAX time-intelligence functions. It mapped out complex RFM customer segmentation into something regional managers could understand at a glance.
The Deliverables
Key Findings & Future Scope
20% of customers drive 32% of total revenue.
RFM segmentation showed that a tiny fraction of the customer base drove almost all the high-margin sales. This let the marketing team completely change how they handled retention.
Next Steps: AI & Automation.
Right now, the pipeline relies on SQL statistical anomalies. Next, I'm integrating Scikit-learn to do predictive anomaly detection, plus an alerting system that emails regional directors the second a KPI drops.