Data Analyst
🤹 Skills
📥 Data Collection & Querying
MySQL, Excel
🧹 Data Cleaning & Validation
Pandas, NumPy, Excel
📊 Analysis & Manipulation
Python, Jupyter Notebook, Pandas, NumPy
📈 Visualization
Tableau, Power BI, Matplotlib, Seaborn
🤖 Machine Learning
Scikit-learn (sklearn)
🛠️ Tools & Platforms
Git/GitHub, Excel, Jupyter Notebook
💡 Generative AI
ChatGPT for productivity, storytelling, and rapid ideation
🌐 Languages
English, Hindi
🧑🎓 Education
| 🎓 Exam/Degree | 🏫 Institution | 📅 Year | ⭐ Score |
|---|---|---|---|
| Common Admission Test (CAT) | Indian Institutes of Management (IIMs) | 2024 | Percentile: 96.06 |
| B.E., Electronics and Communication (ECE) | UIET, Panjab University, Chandigarh | 2024 | CGPA: 8.59 |
| Class 12th | Govt. Model Sr. Sec. School, Chandigarh | 2020 | 92.8% |
🔧 Work Experience
Freelance Data Analyst
Independent Projects | Remote
Jan 2025 – Present
- 🚀 Delivered end-to-end analytics solutions including automated BI pipelines, MySQL databases, and interactive Power BI dashboards across sales and sports domains.
- 🔍 Engineered data validation frameworks and exploratory analysis workflows to ensure data quality and uncover actionable insights.
- 💡 Leveraged AI tools to enhance documentation quality, workflow efficiency, and project delivery speed.
Research Analyst Intern
GreyB Research Pvt. Ltd. | Punjab, India
Jan 2024 – June 2024
- 🔍 Conducted in-depth prior art searches using Derwent and Orbit across global patent and technical databases.
- 📝 Delivered comprehensive search reports highlighting key insights, claim charts, and critical prior references to support legal and R&D teams.
- ✅ Contributed to patentability, invalidity, and freedom-to-operate (FTO) assessments, enabling informed IP decisions.
- 🏅 Certified as a Specialist-level Patent Analyst for exceeding quality and speed benchmarks.
🚀 Projects
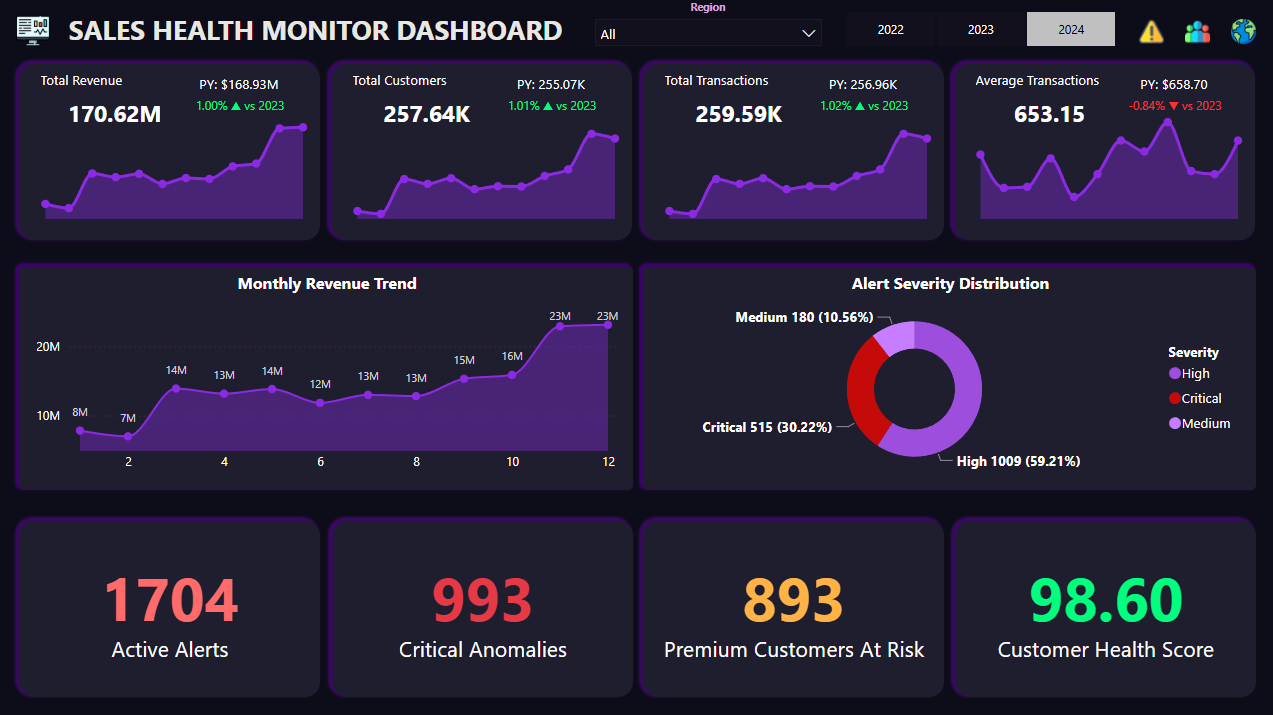
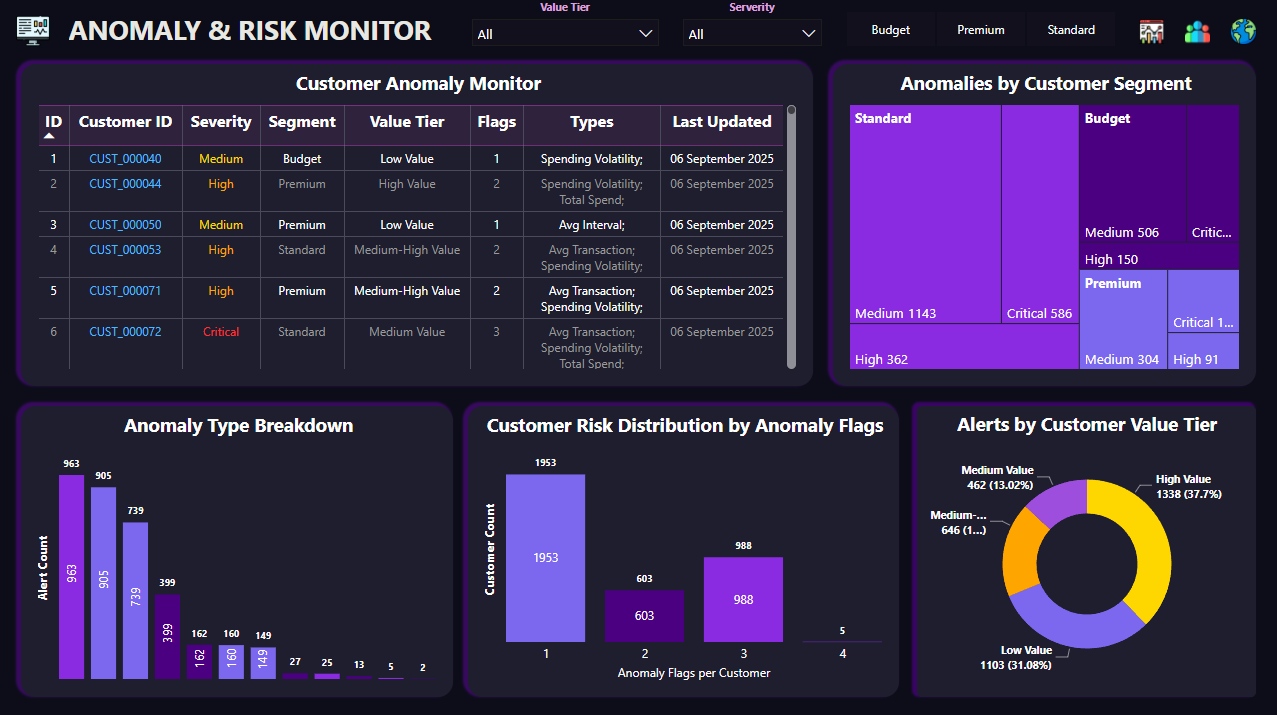
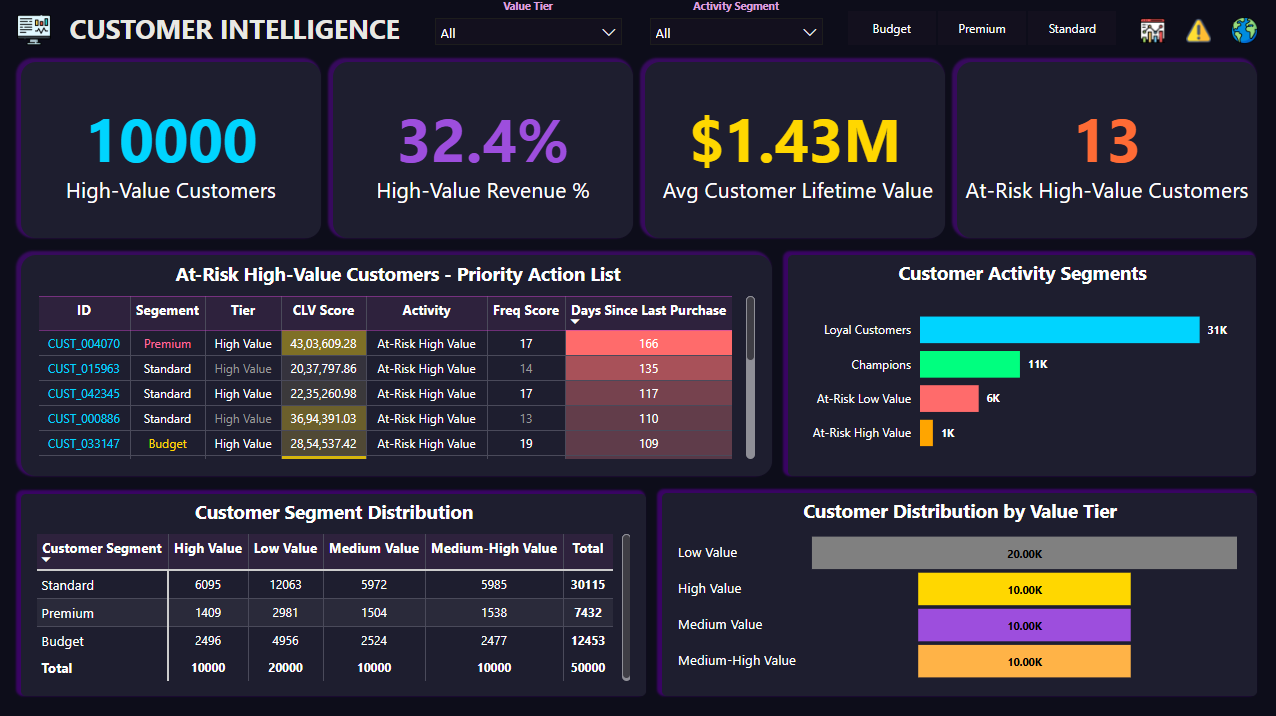
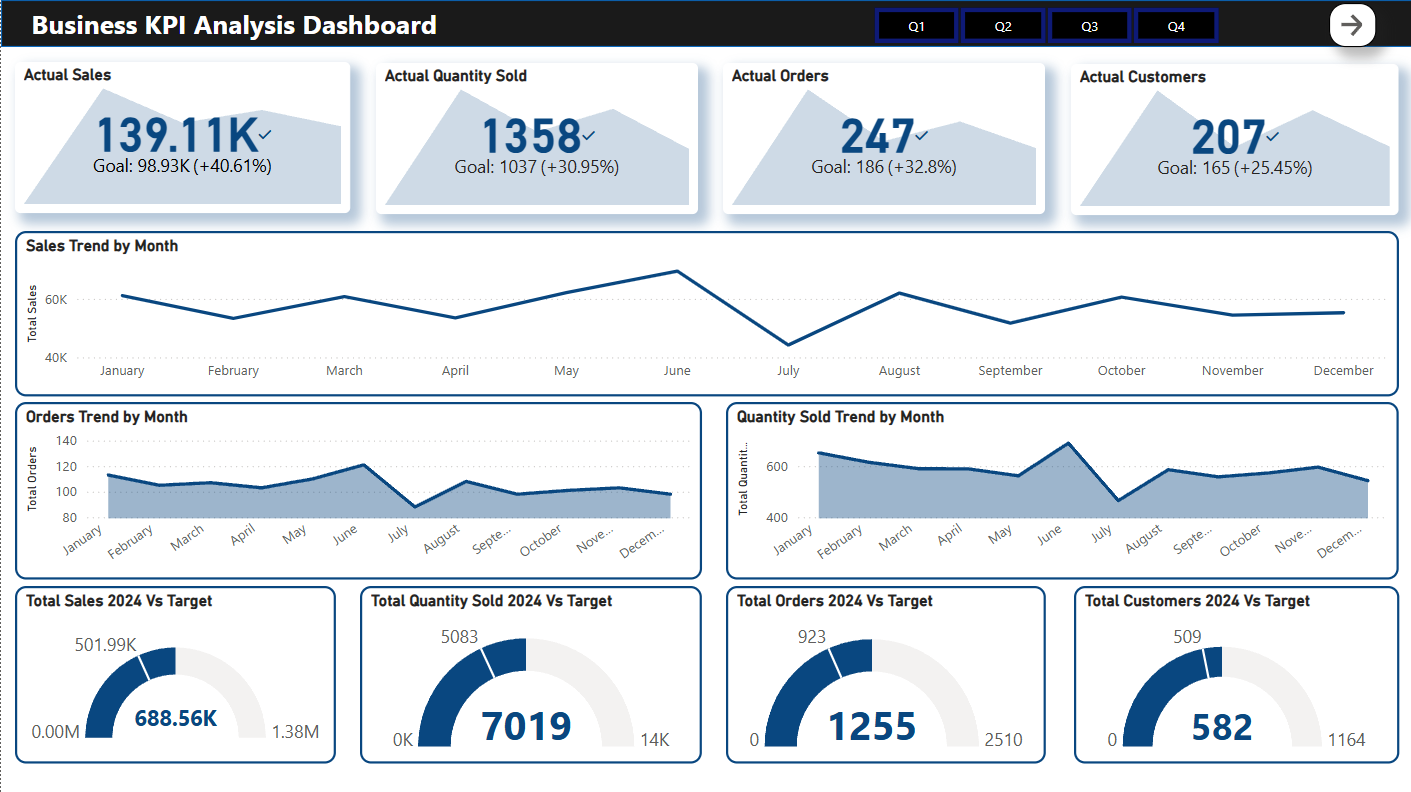
📊 Sales Health Monitor – Automated BI Pipeline
- 🚀 End-to-end automated BI pipeline processing 800K+ retail transactions.
- 🗄️ Engineered MySQL star schema database with 8 tables and 11 analytical views for scalable data modeling.
- 🔍 Built adaptive anomaly detection framework reducing false alerts by 85% through percentile-based thresholds.
- 📊 Developed 4 multi-page Power BI dashboards with custom DAX measures for executive, risk-monitor, customer, and geographic intelligence.
- 🧪 Conducted comprehensive EDA using Python (Pandas, NumPy, Matplotlib, Seaborn) uncovering seasonality patterns and customer segmentation.
- ⚙️ Designed modular automation workflows for data generation, cleaning, validation, and dashboard refresh cycles.
- 💡 Dashboard enables stakeholders to track YoY growth, revenue drivers, and high-value customer segments in real-time.
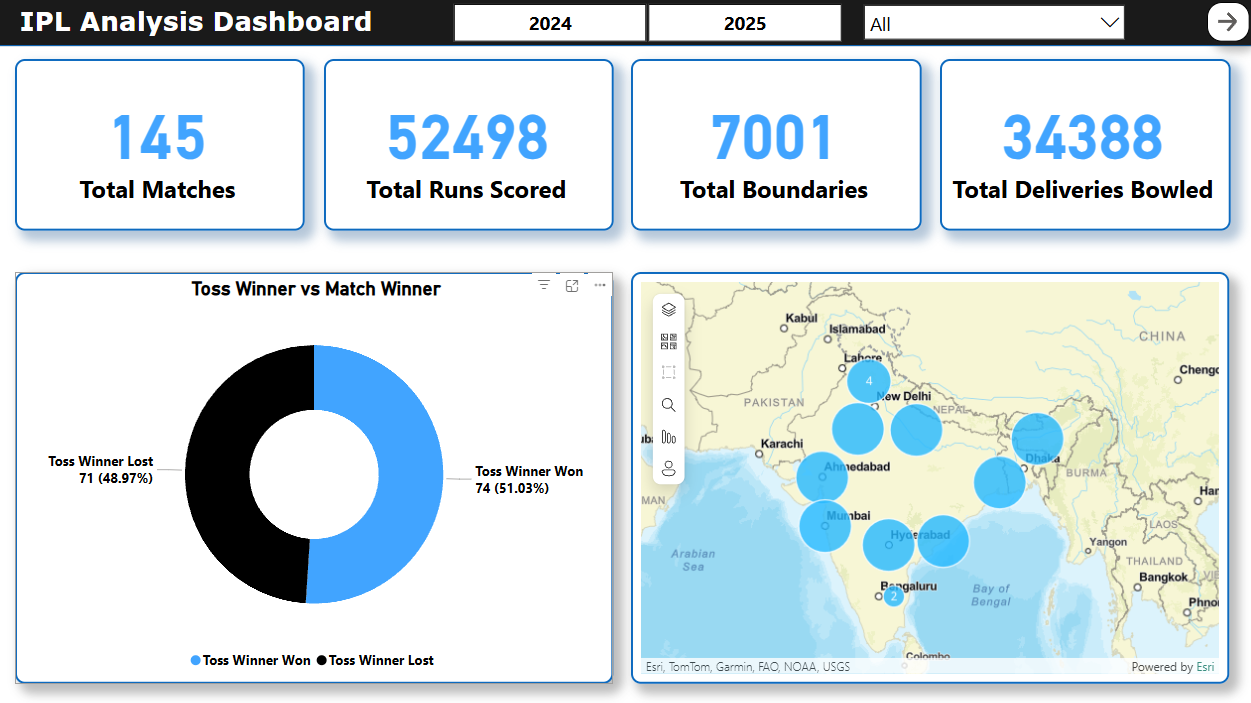
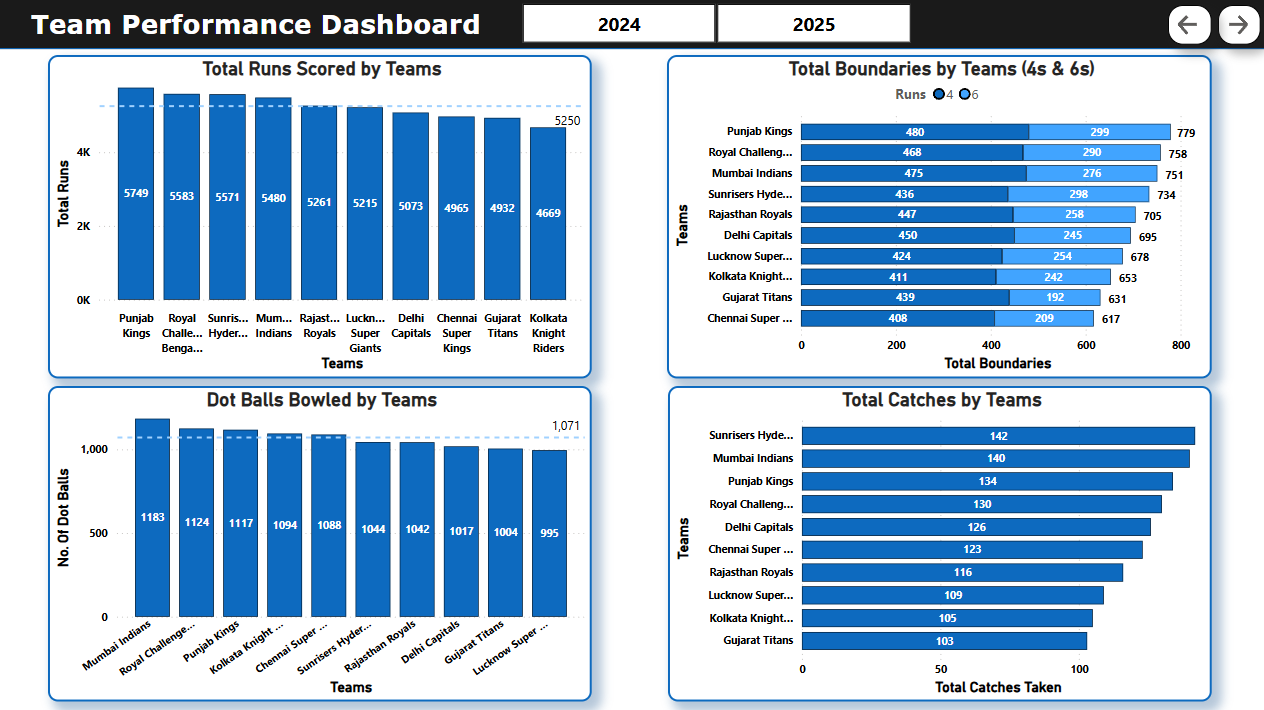
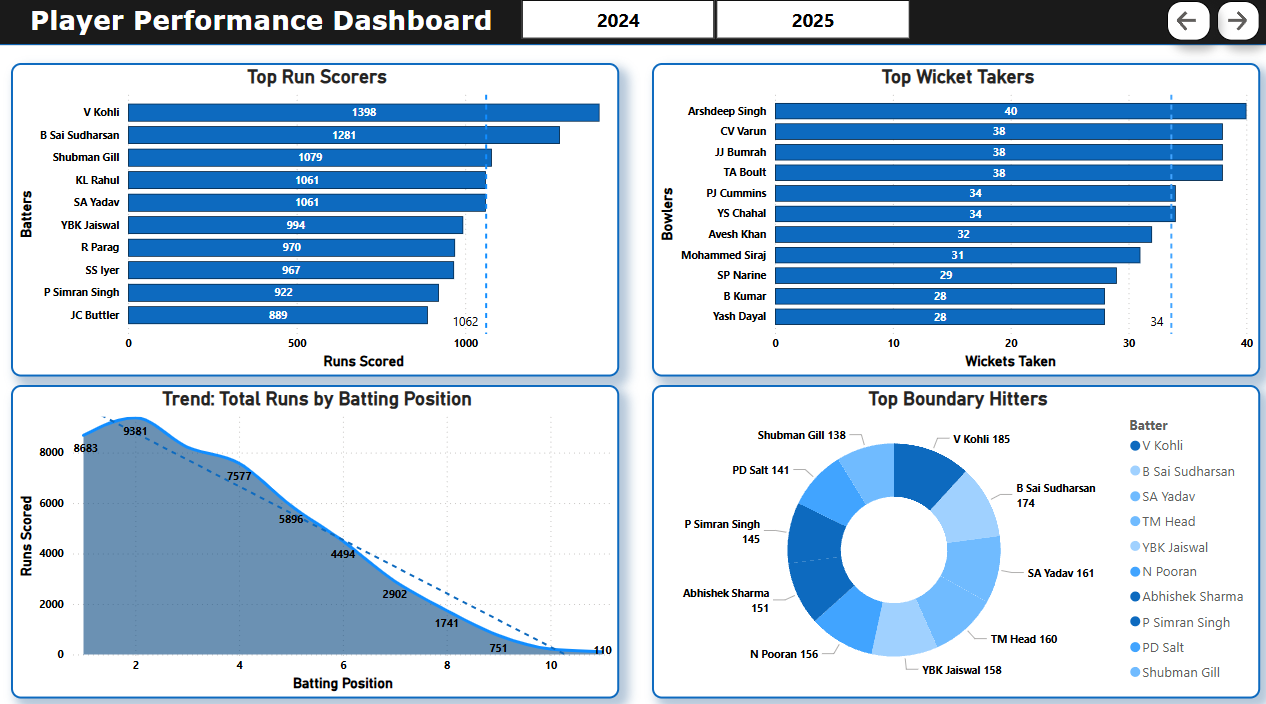
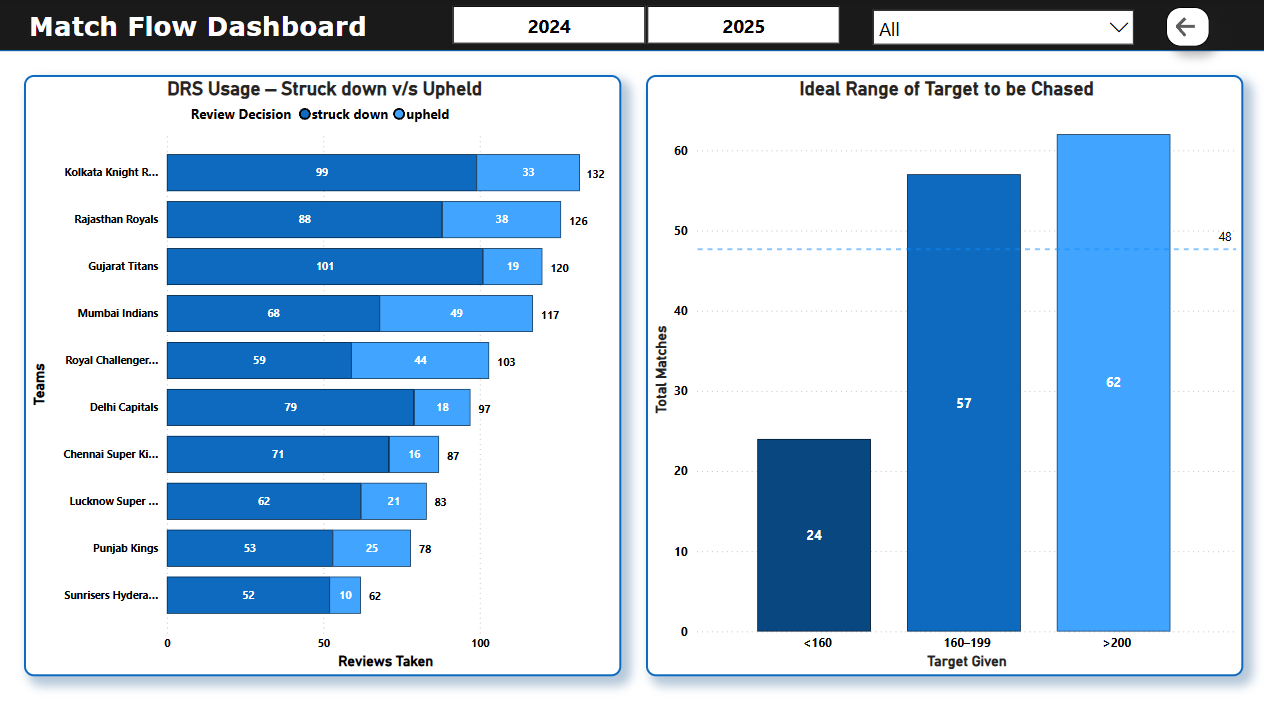
🏏 IPL Data Analysis (Season 2024 and 2025)
- 😎 Interactive Power BI Dashboard built for IPL 2024 & 2025 seasons.
- 🗃️ Extracted datasets on seasons, players, and matches using structured SQL queries.
- 🧪 Performed EDA at player and team level using Python (Pandas, Matplotlib, Seaborn).
- 📊 Created dynamic KPIs, trend charts, and filters in Power BI for match behavior and performance.
- 🧠 Used ChatGPT to assist in storytelling, querying logic, and content generation.
- 💡 Dashboard designed to help stakeholders explore season insights, team performance, and player impact.
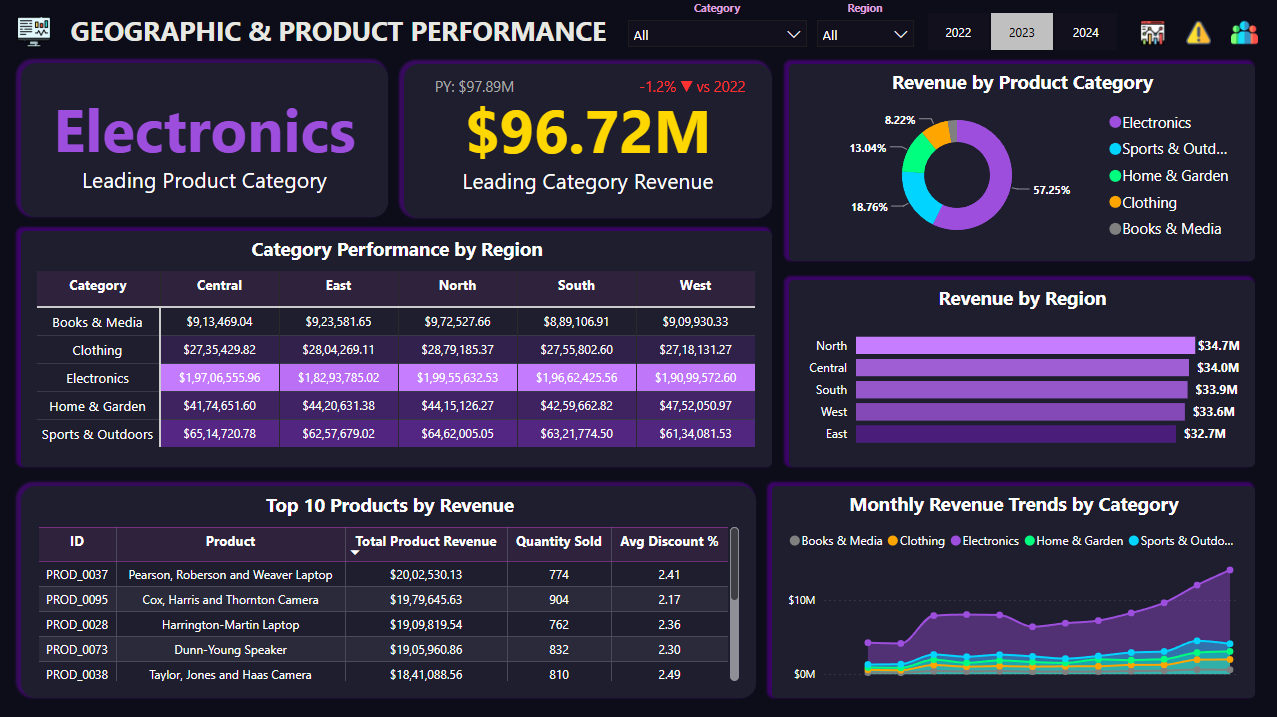
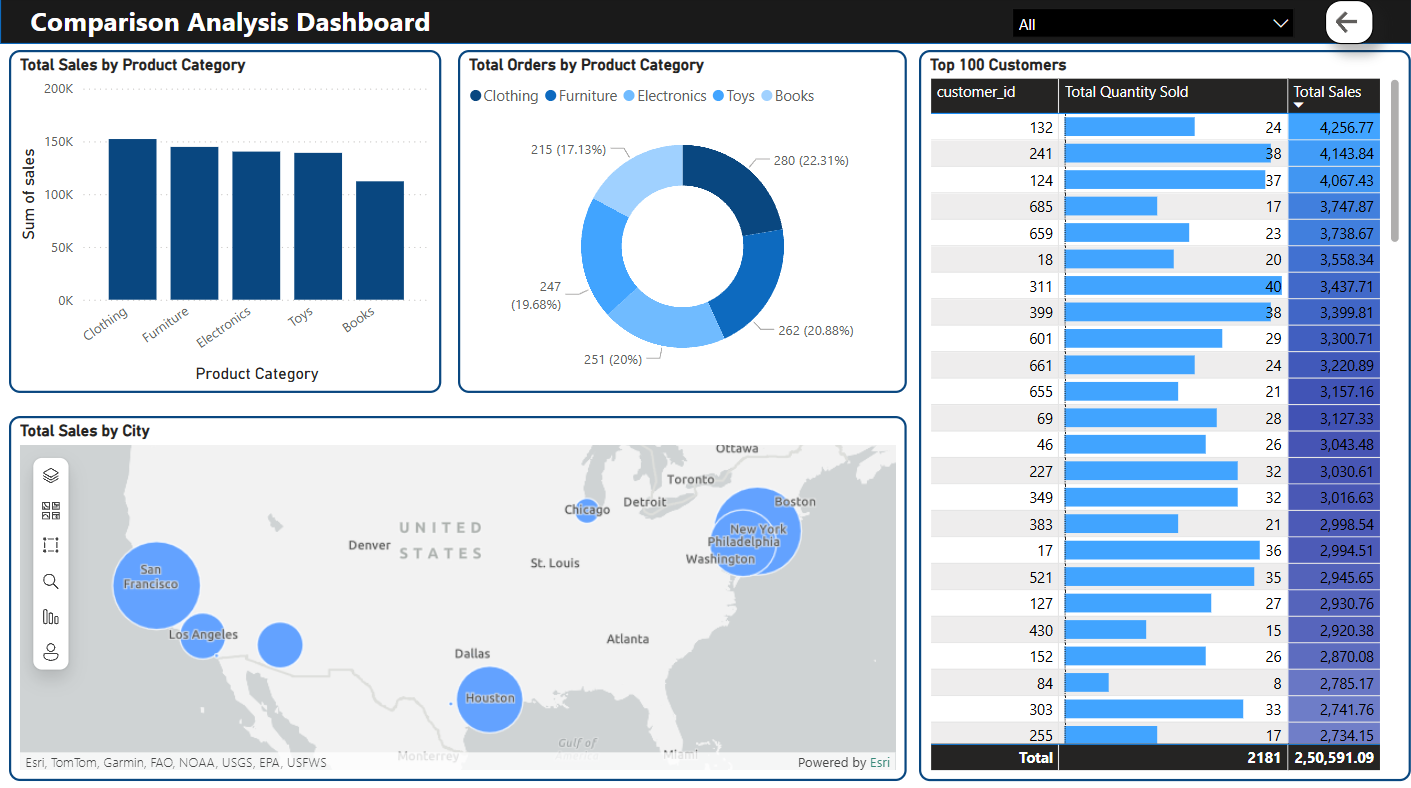
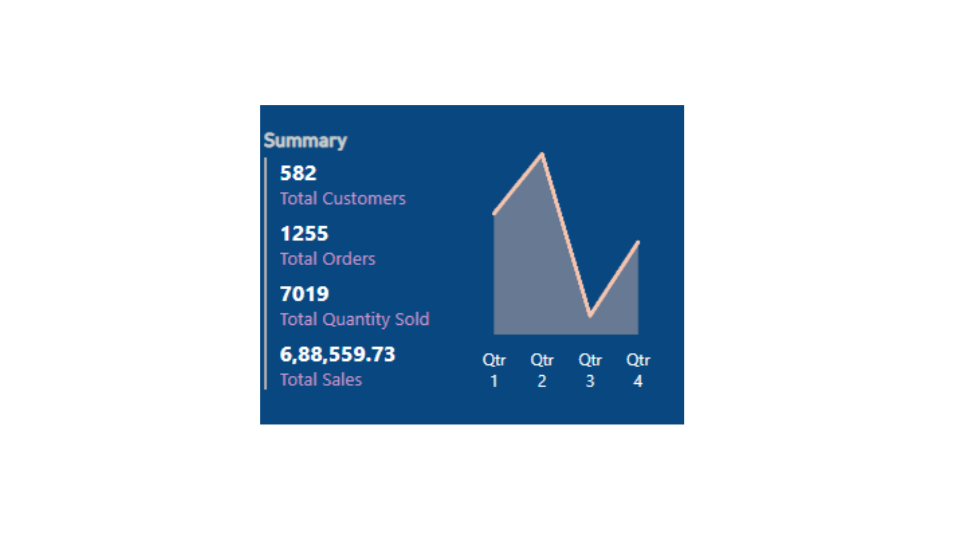
🛍️ Sales Data Comparison & Analysis (2023–2024)
- 🐍 Created realistic synthetic sales data for 2023 and 2024 using
Faker,NumPy, and Python logic blocks. - 🧹 Cleaned and structured datasets to match realistic product, customer, and date patterns.
- 📊 Built a multi-page Power BI dashboard with maps, tooltips, slicers, KPIs, and charts.
- 🤖 Used ChatGPT as a co-pilot for debugging, markdown writing, and visual planning.
- 🔁 Focused on understanding growth trends, top customers, and product performance.
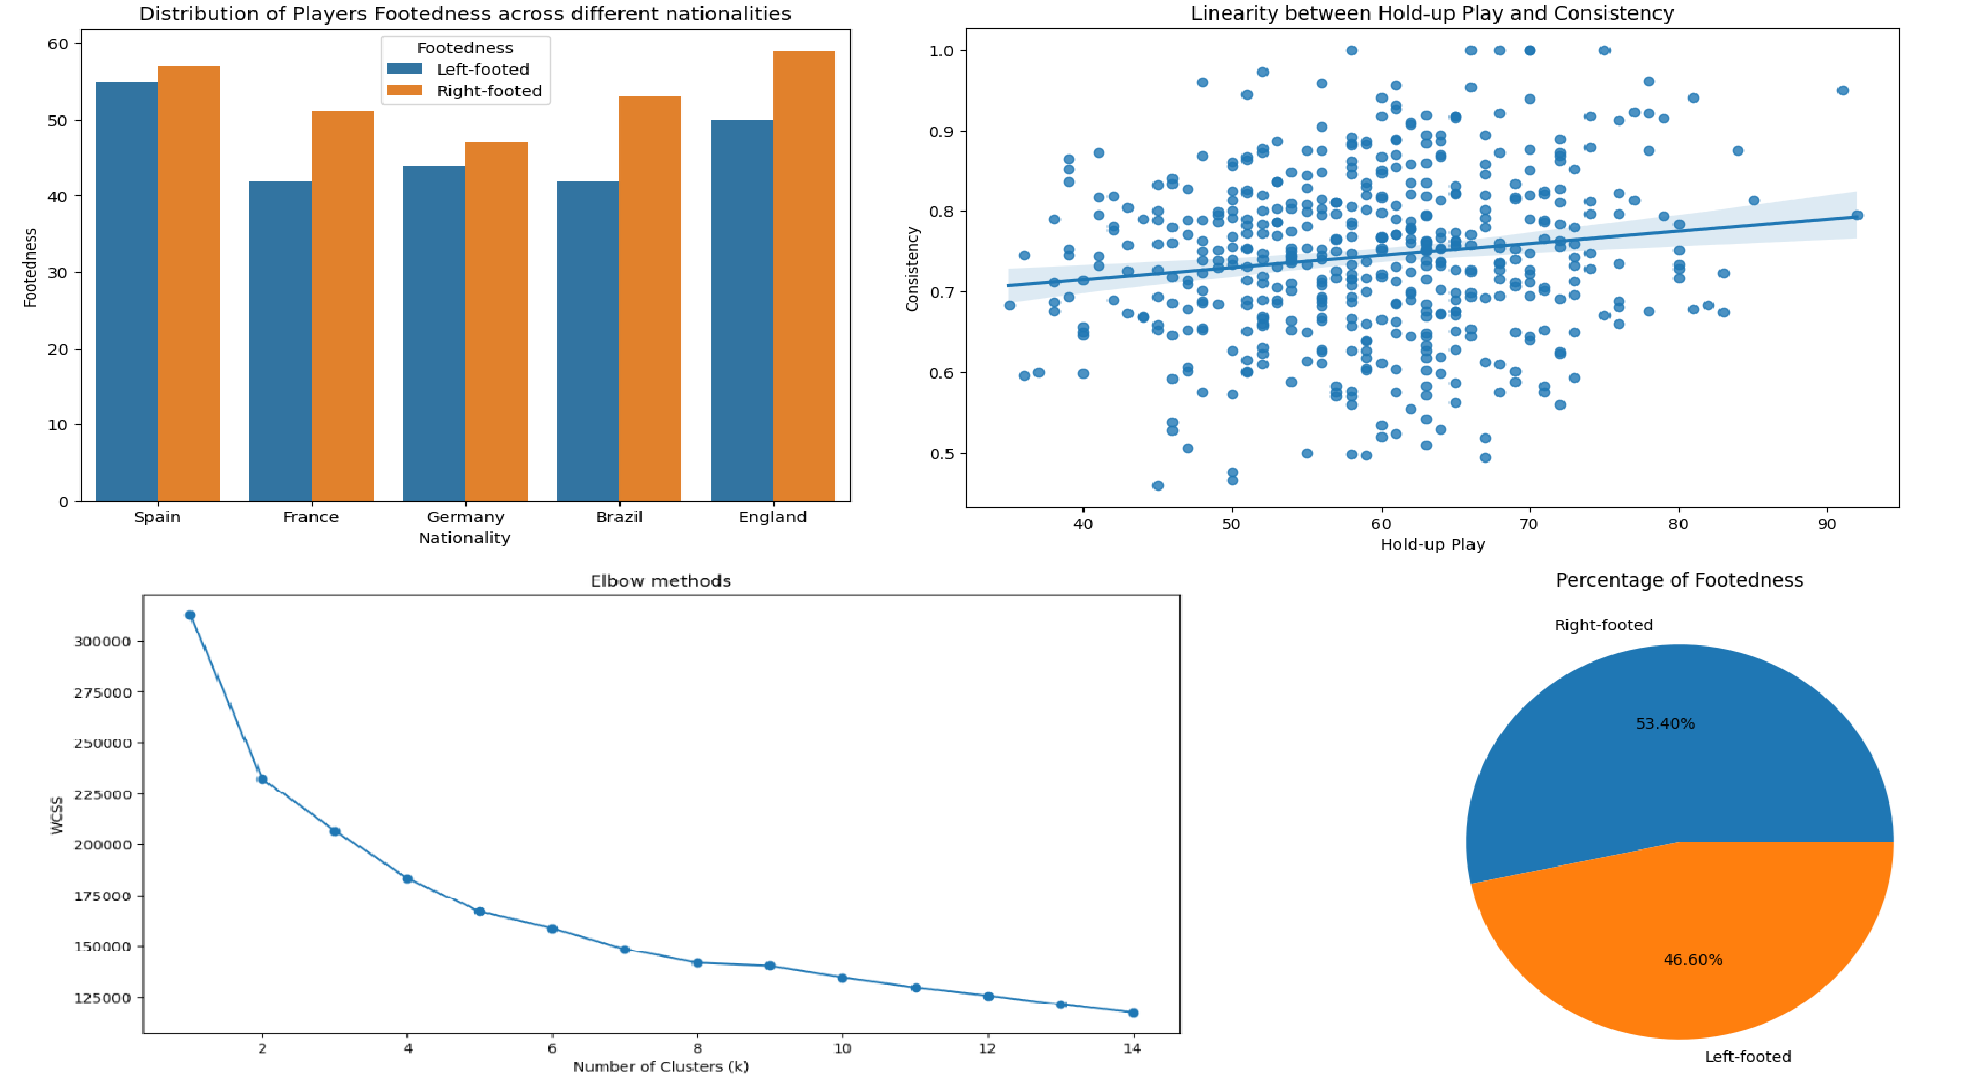
⚽ Football Striker Performance Analysis
- 🧠 Explored what separates an average striker from an exceptional one using data on 500 professional footballers.
- 🧪 Used Python (pandas, seaborn, matplotlib, sklearn, statsmodels) for EDA, hypothesis testing, clustering, and logistic regression.
- 🧹 Applied encoding, imputation, and scaling techniques for preprocessing.
- 📈 Clustered players into “Top Strikers” and “Regular Strikers” using K-Means.
- 🤖 Leveraged Generative AI (ChatGPT) to validate logic, speed up exploration, and clean documentation.
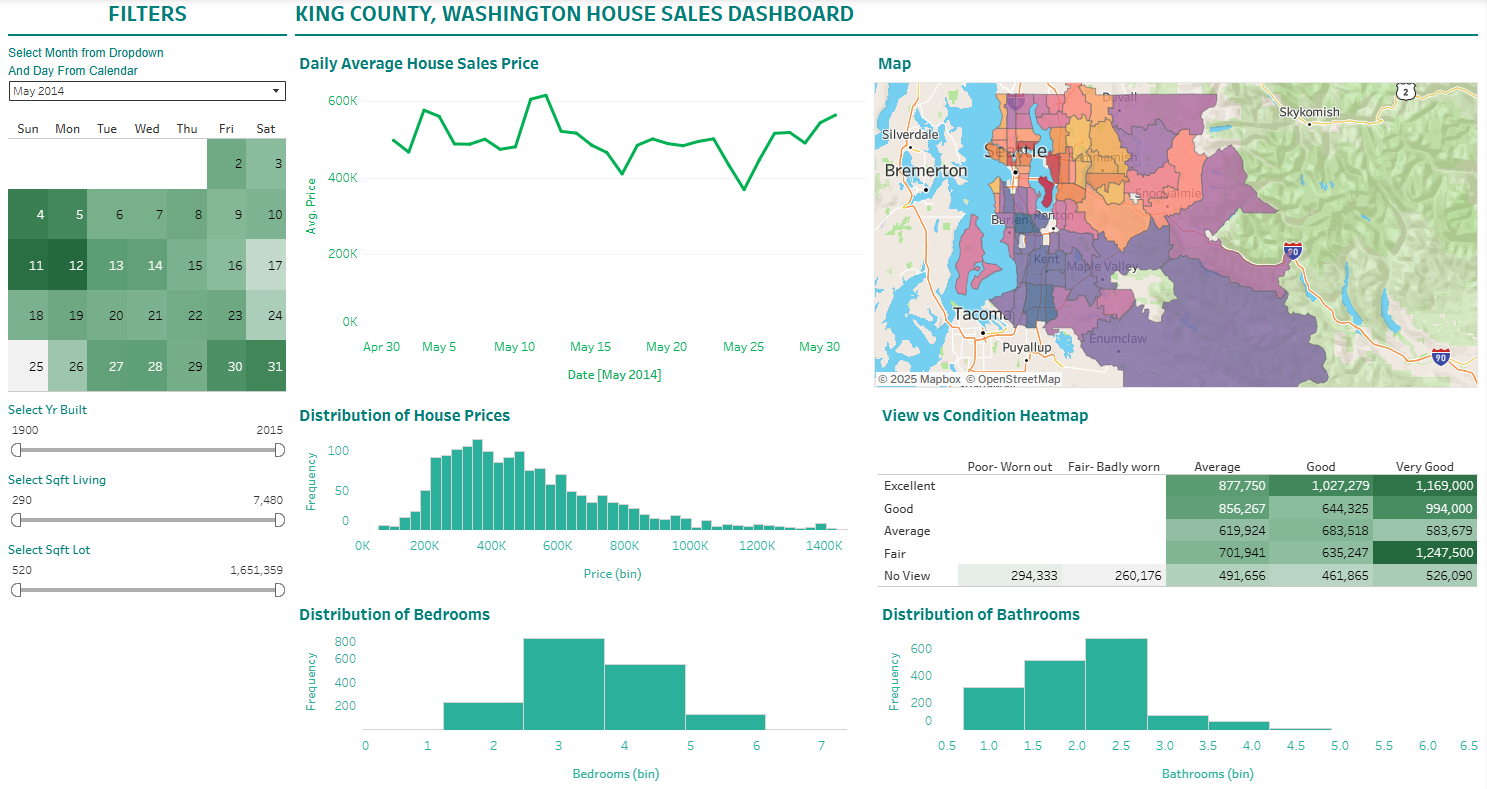
🏠 House Sales Analysis Dashboard
- 📊 Designed an interactive Tableau dashboard to analyze house sales in King County.
- 🎯 Implemented filters and slicers for dynamic insights into pricing, sales trends, and demographics.
- 🗺️ Used maps, KPIs, and bar charts for visual exploration.
- 🧑💼 Tailored for real estate stakeholders to derive actionable insights.