
📊 Sales Health Monitor – Automated BI Pipeline
A comprehensive end-to-end automated BI pipeline processing 800K+ retail transactions across customers, products, and regions. Built with Python for data generation and EDA, MySQL for scalable database architecture, and Power BI for interactive multi-page dashboards — combining data engineering, business intelligence, and advanced analytics.
🛠️ Tools & Technologies Used
- Python (Pandas, NumPy, Matplotlib, Seaborn) – Generated synthetic data, conducted comprehensive EDA, and built automation workflows.
- MySQL – Designed star schema database with 8 tables and 11 analytical views for scalable data modeling.
- Power BI & DAX – Created 4 multi-page interactive dashboards with custom measures for time intelligence and YoY tracking.
- Generative AI (ChatGPT) – Used for workflow optimization, debugging SQL queries, DAX troubleshooting, and documentation enhancement.
🔗 Links
📁 Dataset Description
This project uses synthetic retail data designed to simulate real-world business scenarios:
🔹 777,288 sales transactions spanning 3 years (2022-2024)
🔹 50,000 customers with segments (Budget, Standard, Premium)
🔹 1,000 products across 5 categories (Electronics, Clothing, Home & Garden, Sports, Toys)
🔹 5 geographic regions with 50+ cities
All datasets were generated using Python to replicate realistic sales patterns including seasonality, customer behavior, and regional variations.
🎯 Problem Statements / Goals
This project goes beyond basic dashboards — it’s about building an intelligent monitoring system that answers:
- 📊 How do we track executive KPIs (revenue, customers, transactions) with YoY comparisons?
- 🚨 Can we detect anomalies in customer behavior and product performance automatically?
- 👥 Who are our high-value customer segments and what’s their lifetime value?
- 🗺️ Which regions and products drive the most growth?
- ⚙️ How do we build automated workflows that refresh data and dashboards daily?
- 🎯 Can we reduce false alerts by 85% through adaptive thresholds?
🔄 Project Workflow
Phase 1-4: Python (Data Generation & EDA)
Data Generation:
- Created 800K+ realistic transactions with temporal patterns, seasonality, and customer segmentation.
- Simulated discount strategies, product lifecycles, and regional variations.
Data Cleaning & Validation:
- Achieved 100% quality score through automated validation checks.
- Handled missing values, outliers, and data type standardization.
Exploratory Data Analysis:
- Temporal Analysis: Identified Nov-Dec-Jan peak months (140-160% above average).
- Geographic Intelligence: Mapped regional performance and growth trends.
- Customer Segmentation: RFM analysis uncovering 20% of customers driving 32% of revenue.
- Product Portfolio: Category-level performance tracking and anomaly detection.
Phase 5: MySQL Database Engineering
Star Schema Architecture:
- Fact Table:
sales_transactions(777K+ records) - Dimension Tables:
dim_customers,dim_products,dim_dates - 11 Analytical Views: Pre-aggregated KPIs for dashboard performance
Key Innovation – Adaptive Anomaly Detection:
- Built percentile-based threshold system that adjusts dynamically.
- Reduced false alerts from 10,049 to 1,524 (85% improvement).
- Tracks customer behavioral anomalies, product performance drops, and revenue spikes.
Phase 6: Power BI Dashboards
Built 4 specialized dashboards with 34 interactive visuals:
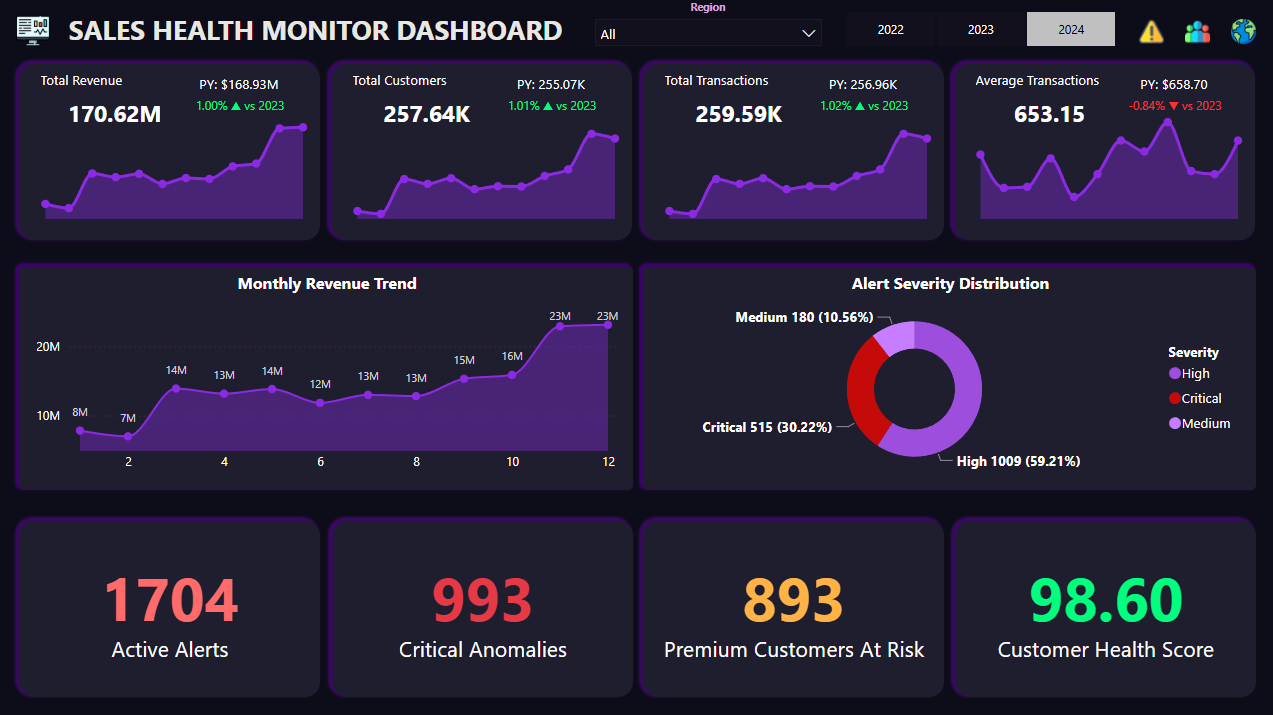
📄 Dashboard 1: Executive Overview
- 📌 KPI cards with YoY growth indicators (▲/▼)
- 📈 Revenue trends by month, quarter, year
- 🎯 Top products and categories by performance
- 🔄 Dynamic filters for time-based analysis
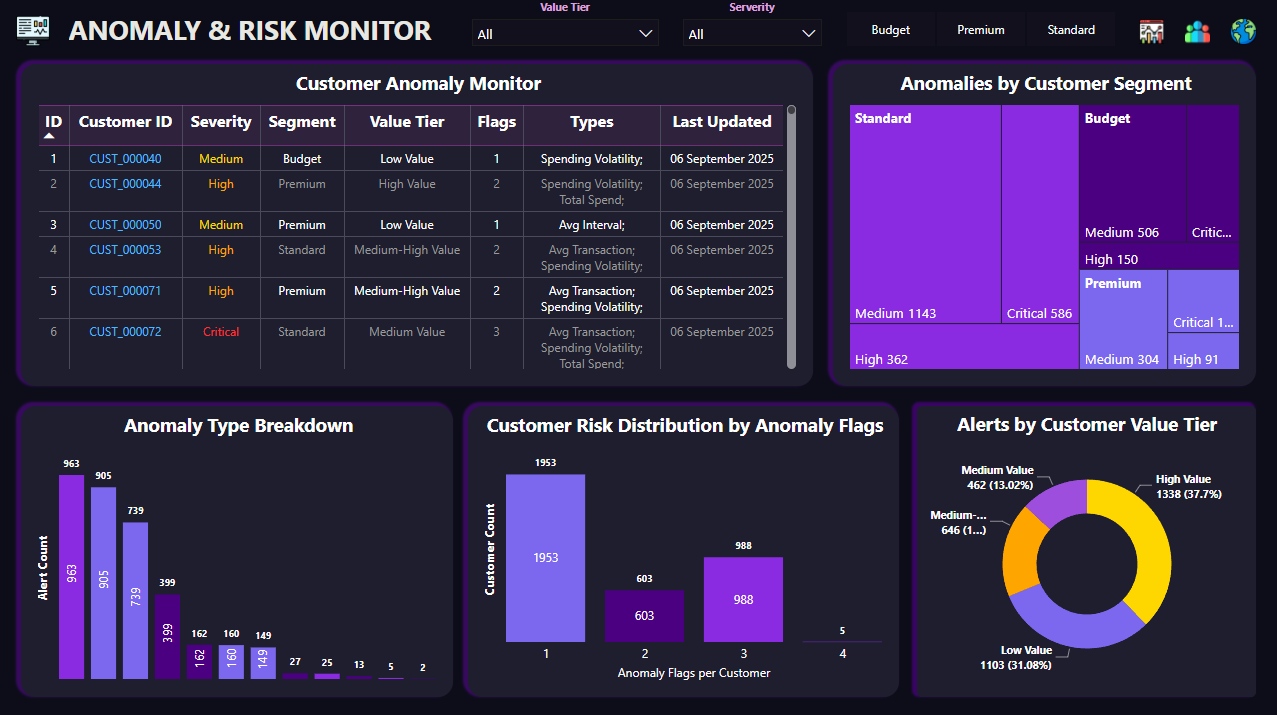
📄 Dashboard 2: Anomaly & Risk Monitor
- 🚨 Customer behavioral anomalies
- 📉 Product performance alerts
- ⚠️ Revenue spike/drop detection
- 🎯 ML-ready framework for future integration
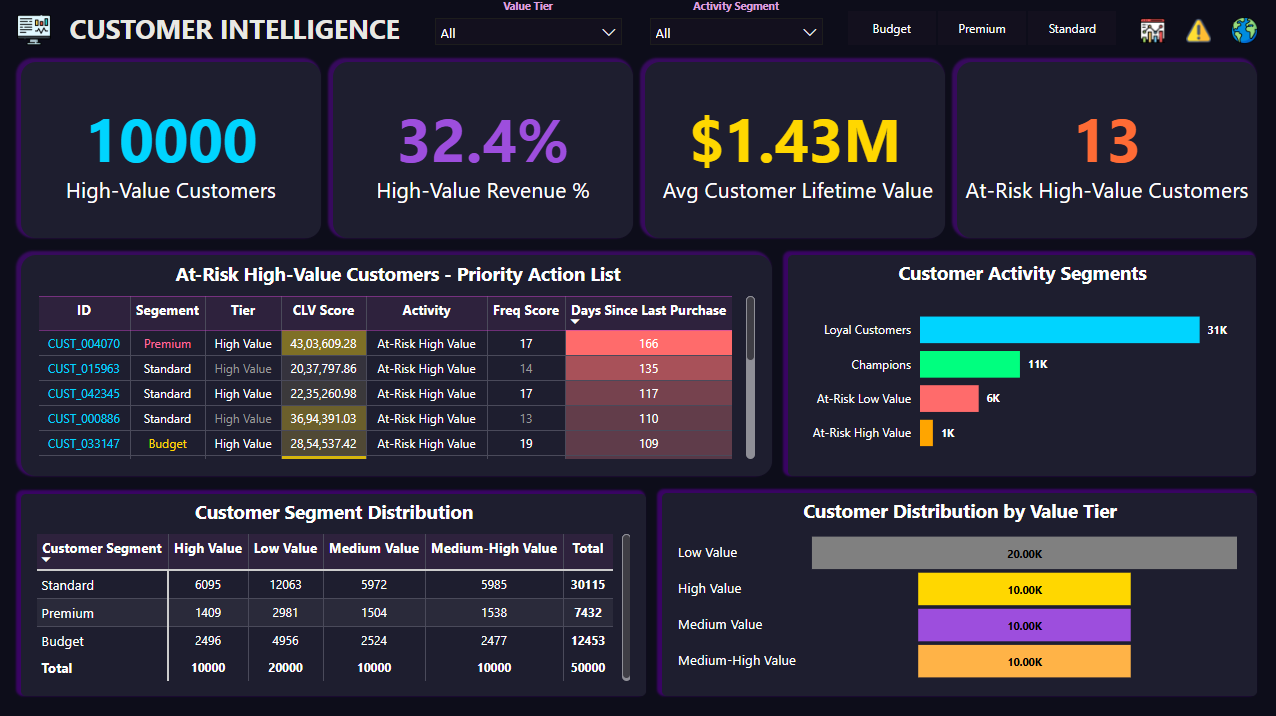
📄 Dashboard 3: Customer Intelligence
- 👥 Customer lifetime value (CLV) analysis
- 📊 RFM segmentation (Recency, Frequency, Monetary)
- 🏆 High-value customer identification
- 📈 Cohort analysis and retention tracking
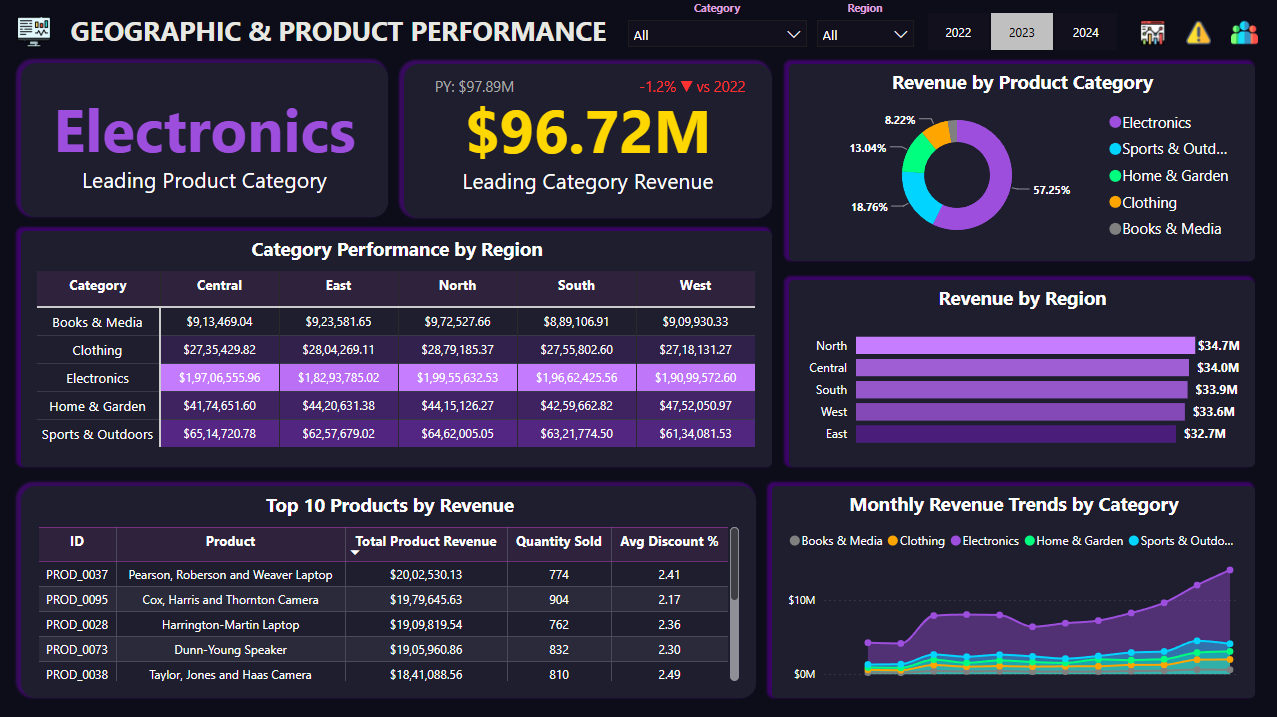
📄 Dashboard 4: Geographic & Product Performance
- 🗺️ Regional performance heatmap
- 📦 Product portfolio matrix
- 🌍 City-level revenue breakdown
- 📊 Category growth indicators
Advanced DAX Techniques:
- Time intelligence functions (SAMEPERIODLASTYEAR, TOTALYTD)
- HASONEVALUE filter awareness for “All” selections
- Conditional formatting with hex color codes
- Dynamic YoY growth calculations with unicode arrows
💡 Key Insights & Achievements
- 📊 800K+ transactions processed through automated pipeline
- 🗄️ MySQL star schema with 8 tables optimized for BI queries
- 🔍 85% reduction in false alerts through adaptive anomaly detection
- 📈 Seasonality patterns identified: Nov-Dec-Jan peak at 140-160% above average
- 👥 Customer segmentation: 20% high-value customers drive 32% of revenue
- 🌍 Regional insights: 5 regions analyzed with city-level granularity
- ⚙️ Automation-ready: Modular design supports scheduled workflows
🚀 Things I Learned
- How to design and implement a star schema database for BI workloads.
- Building adaptive anomaly detection using statistical thresholds instead of ML.
- Advanced DAX patterns including time intelligence and filter context handling.
- Structuring projects for automation with modular, reusable code.
- Database optimization through views and indexed relationships.
- Creating multi-page dashboards that tell a complete business story.
- Using AI tools to accelerate debugging, documentation, and design decisions.
📦 How to Explore This Project
- 📥 Clone the GitHub repository.
- 🐍 Run the Jupyter notebooks to see data generation and EDA process.
- 🗄️ Import SQL scripts into MySQL to build the database.
- 📊 Open the Power BI
.pbixfile and connect to your MySQL instance. - 🧭 Use dashboard filters and slicers to explore interactive insights.
🔮 Future Enhancements (Phases 7-9)
- 🤖 ML Anomaly Detection: Customer churn prediction and revenue forecasting models.
- 💬 AI Text Insights: Auto-generated executive summaries using OpenAI API.
- ⚙️ Full Automation: Daily pipeline running at 6 AM with email alerts.